Imagine you had to choose, and could choose: you can spend your whole life and raise your family in either of two equally prosperous countries. In one country people work lots of hours to attain that prosperity. In the other country people work far less. You don’t know anything else about these countries.
Which would you choose? The answer seems kind of obvious, right? Equally prosperous, and less work for me and my family? Sign me up!
But that straightforward question is almost never asked, explicitly, in discussions of prosperity, growth, and national well-being. The most obvious measure of that difference — hours worked per capita — is buried, invisible, and unavailable in the various national data sets scattered around the web. (The typical national measure you see out there is hours worked per worker.)
For the curious, here’s how more-prosperous countries (OECD and a handful of others) sort on the “hard-working” scale:
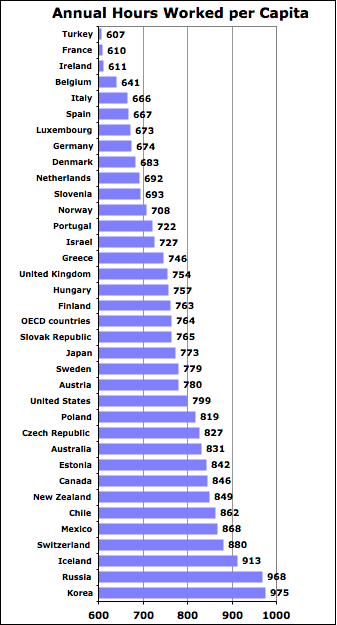
This average includes the whole population — workers, children, students, retirees, etc. — so it’s an index of how much the average person has to work over the course of their life. (More hours during working years, less or none during non-working years; it’s an average.)
There’s one main generalized takeaway from this that I see: The less-work end of the spectrum is dominated by western European countries. People there work far less hours in the course of their lives. People in “Anglo”-model countries work far more.
Going back to choosing a country: you also want to know how prosperous it is in pure money terms, using something like GDP per capita. Here’s that (I’ve excluded tiny, crazy-high-GDP Luxembourg here — think: banking — to show other countries more clearly):
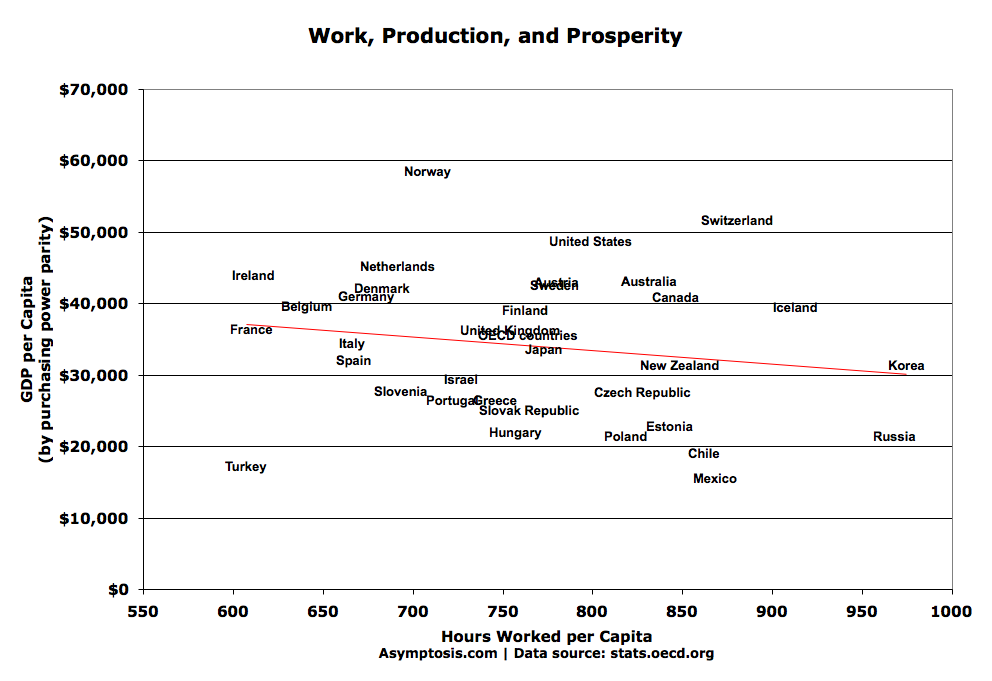
If you’re a rational shopper, you’ll choose Norway (yeah, they’ve got the advantage of all that oil…), Ireland, the Netherlands, or another country in the upper left. If an extra $5,000 or $10,000 a year is worth sacrificing four or five extra weeks of work, choose the U.S. (Think: “buying” an extra month of time with your family, doing things you like and love, every year. You decide. But do I need to remind you that 1. Life is short, and 2. “Family values” really do have value?)
One perhaps-surprising takeaway from this graph: hard-working countries aren’t richer. QTC. Causation? It seems improbable that working less would cause higher prosperity. Higher prosperity could quite reasonably cause people to work less. (The good old substitution effect, income versus leisure.) But the most likely conclusion is that high productivity (GDP per hour worked) is the 800-pound gorilla when it comes to prosperity. Long hours worked have zero or negative apparent effect on prosperity.
(Interesting parallel: hours worked per household member in the U.S. only “explain” seven percent of the variance between household incomes. Whodathunkit?)
Rather than eyeballing that scatter plot, you might want a handy index of which country to choose. Here’s one approach to what I’ll call Work-Weighted Prosperity: GDP/Capita divided by Hours Worked/Capita. If people in one country have to work lots of hours to get that prosperity, it gets ranked lower.
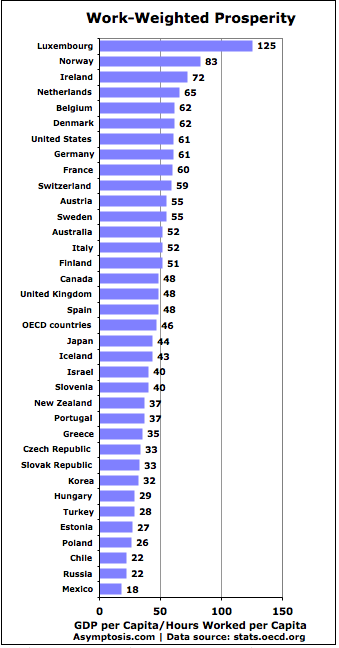
The takeaway here? Move to Luxembourg and get into banking.
The curious among you are probably wondering about different countries’ working-age populations (doesn’t actually vary that much), and the percentage of working age that are working (varies somewhat more). Here’s the spreadsheet.
Cross-posted at Angry Bear.
Comments
One response to “Which Countries Work Hardest? You Might (Not) Be Surprised”
[…] Älánek v angliÄtinÄ› naleznete zde a hned na prvnÃm grafu si můžete vÅ¡imnout, že z hlediska roÄnÄ› odpracovaných hodin jsou na […]