I wanted to bring a discussion from comments into a post so we could see all the pretty pictures.
Jazzbumpa: “since roughly 1980 … GDP growth has been in decline”
Chris T: “It’s true annual growth rates have slowed, but so has the decline in GDP during recessions (at least prior to the most recent one).”
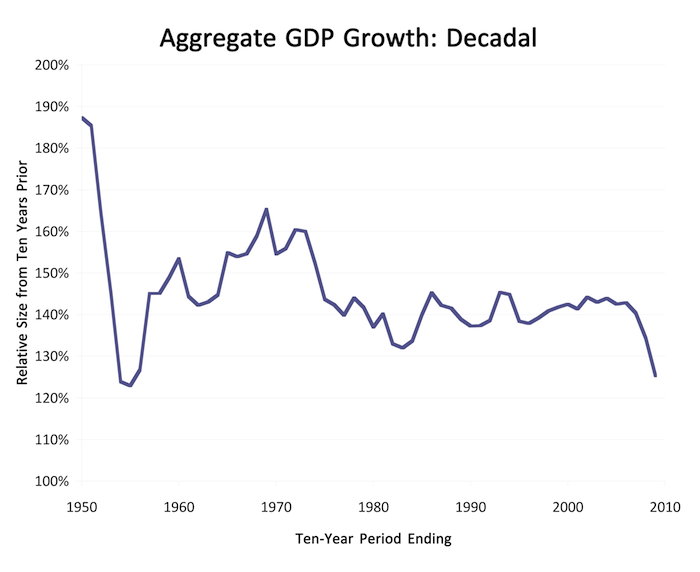
Chris shares the following graphs. (I’ve tweaked slightly — titles, axis labels.) They look pretty much the same:
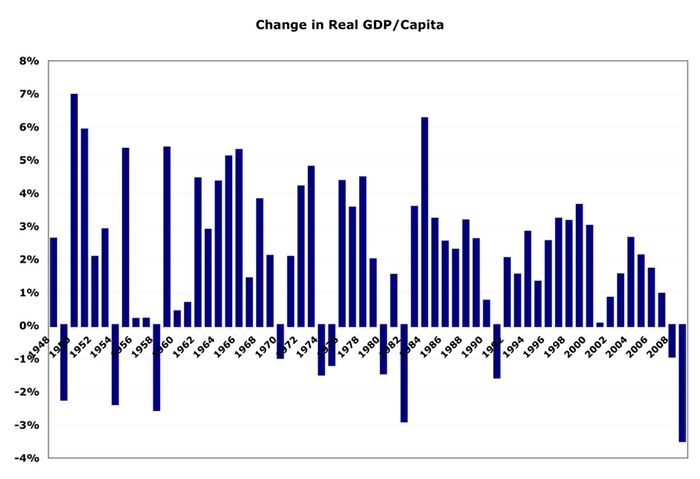
Which prompted me to create the following, because GDP/capita is really the salient measure. (I thought bars better represented the discrete nature of the data points.)
First, annual changes:
It looks generally higher at the left, but Chris is right: look at all the negatives. Between ’84 and ’07, there’s only one negative. That’s partially because inflation was so tame. (Remember, these are inflation-adjusted figures.)
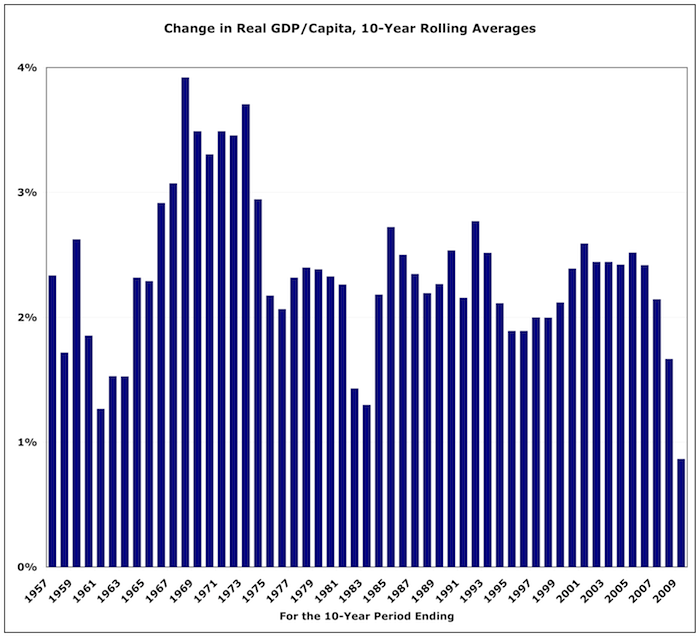
Here it is smoothed using ten-year rolling averages:
This gives the same immediate impression as Chris’s graphs: growth was generally faster in the first half of the post-war era, especially 1963-74.
I’m not a big fan of writing stories based on eyeballed time-series graphs, but here I go:
Jazzbumpa’s not really right about GDP growth having “been in decline” since 1980. It’s just been generally lower (until recently).
There’s that huge trough for roughly ’73-’83. It’s partially because these are all inflation-adjusted numbers, and inflation was high then, devouring nominal growth.
If I could choose when to be born based purely on this graph, I’d choose ’64. Fast growth for the next ten years, and when you hit the job market in ’82 or ’85, things are poised for quite reasonable growth.


Comments
14 responses to “Economic Growth in Postwar America: Looking At GDP”
Jazzbumpa’s not really right about GDP growth having “been in decline†since 1980. It’s just been generally lower (until recently).
You’re splitting semantic hairs, but I really am right. On any of your graphs above, plop a straight line along the peaks, and note the slope.
I did that here on a log scale.
http://jazzbumpa.blogspot.com/2010/10/us-economy-is-dying.html
Peak to peak slopes are getting continuously smaller.
Here on a Quarterly % change basis.
http://jazzbumpa.blogspot.com/2010/05/republicans-all-wrong-all-time-post-ww.html
Here on an annual change basis.
http://jazzbumpa.blogspot.com/2009/08/gdp-growth-since-1950.html
Sure, there are ups and downs at a detail level. But the big picture is clearly that the growth of GDP has been in decline for decades.
Cheers!
JzB
Your charts basically say the same thing; growth slowed significantly in the early 70’s and stayed more or less stable (.5-.482-.514) until the 2000s.
Also, harkening back to one of Chris’s comments in the earlier post, the Viet Nam war did not cause huge deficits. Since I have the data at my finger tips, I posted it.
http://jazzbumpa.blogspot.com/2011/01/deficits-in-viet-nam-era.html
I think that makes it a very unique kind of war. If I hadn’t been specifically looking hard at deficits lately, I never would have known this.
Cheers!
JzB
Chris –
Don’t forget the .358 for the most recent period, BEFORE the current recession. To get from here even back to the .358 line is going to take years of growth well above 5% GDP. Each dismal passing year makes that increasingly unlikely. The Rethugs in congress will see to it that there is no meaningful recovery – ever, if they get their way. Deflation favors the rent-collecting class.
Further, the .514 in that series muddies the waters bit — but that was achieved under Clinton. Per Mike Kimmel’s Presimetrics work, the Clinton era was close to stellar in almost all economic respects.
This plays into Steve’s concept – which I share – that Reaganomics has been a flat-ass disaster. Besides that, though, I’m also starting to believe that something underlying the economy changed in the 70’s – pre-Reagan. We can’t rule out deregulation, since that started under Carter, and microprocessors might be a part of it, too.
I wonder, though, if the economy isn’t like the sea – sometimes calm, sometimes stormy, but never really under active human control. We can sail skillfully (or luckily,) or blunder onto the shoals. Reaganomics – and Bush II gave it to us on steroids – has crashed us onto a reef so badly we may never recover. Corporate profits are at record levels, but everything else basically sucks.
Cheers (sort of)
JzB
The point is that they were relatively high for the time and were highly significant in context. The Bretton Woods system pegged the dollar to gold and other currencies to the dollar. The deficits of the late 60’s, although modest by our standards, led to the mass printing of dollars and severe undervaluation of the dollar relative to gold. Other countries became increasingly unwilling to hold dollars and began buying up American gold reserves. Germany was the first to abandon Bretton Woods, but other countries followed. Rampant inflation in the United States resulted and the whole process culminated in Nixon dumping the gold standard.
The difference between .514 and .482 is rather trivial (not to mention the period of 0.482 includes the 1980 recession, before Reagan was even in office).
Chris –
That difference isn’t trivial as the slope on a log scale chart. And there are always either recessions or at least cyclical minima between. We’re connecting peaks. And look at my other two links with percentage changes. GDP growth under Bush II was a big step down compared to Clinton Clinton, even without including ’08 data. Clinton’s term represented a counter trend move. The main trend down has been back in force for a decade.
But let’s not get bogged down in minutia. The fundamental point is that there was a sea change sometime before 1980. I think we’re all agreeing on that. A much as I love blaming everything on Reagan, something else was happening deep in the bowels of the economy.
Cheers!
JzB (promiscuous metaphor mixer)
Here’s an inteesting take.
http://www.realitybase.org/journal/2010/12/29/did-the-decline-of-the-american-middle-class-just-happen-or.html
JzB
I managed to derive the data using your methodology and then further divided each quarter’s growth by the preceding quarter for each peak-peak (got the same slopes you did). I then ran t-tests for each period:
79-89 89-00 00-06
73-79 0.867369493 0.912018861 0.405777781
79-89 0.900236606 0.41958178
89-00 0.157715036
Th difference between the three periods covering 73-00 is insignificant. 00-06 is much more of a break (and even then, most clearly from 89-00). There really isn’t anything to suggest a consistent long term decline other than 00-06 from that data set. So our culprit is indeed some time in the early 70’s.
@Chris T
Hmmm, so much for formatting:
73-79 = Period 1
79-89 = Period 2
89-00 = Period 3
00-06 = Period 4
1&2: 0.867369493 1&3: 0.912018861 1&4: 0.405777781
2&3: 0.900236606 2&4: 0.41958178
3:4: 0.157715036
Wow. I didn’t mean to give you a home work assignment.
I have a real blind spot for statistics. Can you explain what you did and what it means? You can email me if you like. jazzbumpa@gmail.com.
Thanks and Cheers!
JzB
@jazzbumpa
Yeah I always look at this big picture:
http://www.usgovernmentspending.com/downchart_gs.php?year=1946_2015&view=1&expand=&units=p&fy=fy11&chart=H0-fed&bar=0&stack=1&size=l&title=&state=US&color=c&local=s
Every president since WWII has reduced the budget deficit, with three exceptions: Reagan, Bush, and Bush. (Well, and Obama, but he got handed that dog’s breakfast.)
@jazzbumpa “You can email me if you like.”
CC me.
Oh and thanks you guys for going beyond “eybeballing a time series.”
Like, way, WAY beyond.