Randall Wray made a fascinating observation a while back:
Since 1776 there have been six periods of substantial budget surpluses and significant reduction of the debt. … The United States has also experienced six periods of depression. The depressions began in 1819, 1837, 1857, 1873, 1893, and 1929.
And I confirmed it (graphs):
Every depression in U.S. history was preceded by a big drop in nominal Federal debt.
Except this one. (Assuming that it would have been a depression absent herculean efforts by the Fed et al.)
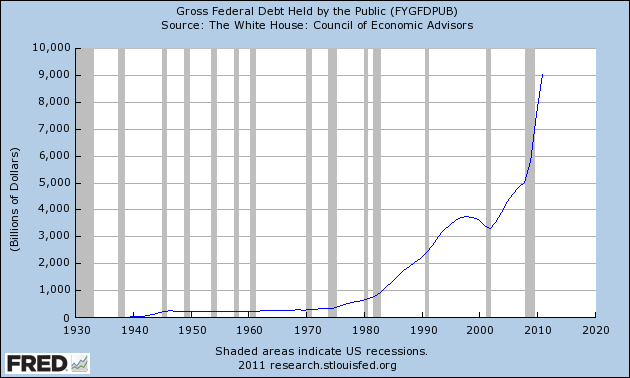
There was that dip in the 90s, but if we want to posit that, based on history, it was an at-least-necessary cause of the crash, we have to ask: why, in this case, did it take almost a decade to have its effect?
A lot of things have changed since 1929.
• We have the FDIC and similar (explicit and implicit).
• The Fed is a much more active player in controlling government “debt” levels.
• The financial system is far more globalized. International flows of financial capital are much larger in proportion to the real economy.
• The stock of outstanding private debt is proportionally much bigger relative to government debt. Ditto the issuance and retirement of private debt relative to government issuance.
• In the 00s in particular, private debt issuance went crazy.
I think there might be a story about private debt carrying the economy for years after government debt got pulled, so we didn’t experience the effect right away.
But I’d love to hear other and better-articulated stories to explain what strikes me as a pretty big anomaly.
This brief conversation might provide a springboard:
rjs: as i’ve understood it, when it became clear to george bush that if clinton surpluses continued & our debt was paid down, the financial system would soon experience a dearth of safe assets & would freeze up; so his adminstrations tax cuts were initiated in order to keep levels of AAA assets high enough for the markets to operate…
David Beckworth: I remember some commentators making that point back in the early 2000s. It would have been interesting to have seen, though, what would have happened had the debt been paid down. Would structured finance made even more AAA-securities to compensate? Would interest rates been lower back then too?
rjs certainly gives George Bush far too much credit for monetary sagacity. But the general point remains.
Cross-posted at Angry Bear.
Comments
28 responses to “This Time Is Different: Federal Debt Didn’t Dive Before the Depression”
The answer is mostly the rise of financial engineering. The process of financial innovation that Minsky was one of the first to identify had basically reached its logical conclusion. Before the 2000s, you couldn’t really convert a portfolio of BBB assets into a bunch of CDO tranches, 65% of which was a AAA tranche. Now you could!
@Ashwin “Before the 2000s, you couldn’t really convert a portfolio of BBB assets into a bunch of CDO tranches, 65% of which was a AAA tranche. Now you could!”
Thanks, Ashwin! Can you be a bit more specific on the mechanics of how that “spun out” the effects of the 90s fed-debt decline (if you give that effect credence), so it took years to have its effect?
Well basically the explosion in the creation of MBS and CDOs fed a lot of the demand for AAA securities as collateral or just as an investment, even if Treasury supply declined or stayed constant. The trend started with simple pass-through MBS (not tranched) which were rated AAA – these have mostly held up OK. But it ended with AAA tranches being squeezed out of portfolios consisting of sub-prime mortgages – even calling it alchemy is being very generous.
And now a lot of what was rated as AAA has defaulted or been downgraded hence the shortage of “safe” assets etc.
Obviously the growth in overall private debt, especially household debt is a part of all this. You need some assets, however junk, to tranche in the first place! But these assets could of course be created ex nihilo by the banking system. So it is plausible that in the manner of the tail wagging the dog, the rush for AAA assets itself had a causal role in the expansion of private credit. Cause and consequence is very difficult to separate in this process.
There was no economic circumstance where Bush wasn’t going to cut taxes once he took office. It was by happenstance really, that his tax cut kicked in when it did post-911 military Keynesianism was probably a bigger boost to AD). Also, there’s a very simple reason that the debt didn’t fall prior to the recession– the trade deficit, which was (and is) a huge demand leakage. If its not offset by a budget deficit at least as large, domestic private sector savings will drain away until the economy implodes (same thing happened in 2000).
Read what Wynne Godley wrote on this point in 2005 and then check out the sectoral balance chart from, say, 2004 to 2008.
“More fundamentally, the budget balance is equal to the difference between the government’s receipts and outlays, but it is also equal, by definition, to the sum of private net saving (personal and corporate combined) plus the balance of payments deficit.
If the private sector decides to save more, the government has no choice but to allow its budget deficit to rise unless it is prepared to sacrifice full employment; the same thing applies if uncorrected trends in foreign trade cause the balance of payments deficit to increase.”.
http://www.guardian.co.uk/business/2005/aug/28/politics.comment
http://www.levyinstitute.org/multipliereffect/wp-content/uploads/2011/11/US-Sectoral-Balances_Berlin.png
Here’s the dilemma MMT supporters face. Its a tough slog to get political support for increased deficit spending in a recession, but its flat out impossible to win that argument during a recovery (the deficit doves having switched to the side of the deficit hawks). In 2007, we had a 4.6% U3, a $163 billion budget deficit… and a $700 billion trade deficit, creating a $537 billion demand leakage. And yet if you measured the output gap by the CBO’s 5.2% NAIRU rate, we were at full employment, indeed, the economy appeared to be overheating. But remember this, full employment economic models assume balanced trade, just as free trade models assumes full employment.
We will never again have a sustained full employment economy until we zero out the trade deficit.
Congress could do this with Warren Buffett’s import certificate cap and trade market or with the Levy Institute’s iteration that’d auction off ICs and use revenue to cut payroll taxes. The Fed could do this unilaterally (under the Gold Exchange Act, with Tsy approval) with a dual exchange rate market. Or (if I had my druthers), Tsy could do this unilaterally by taking the “move the mountain to Mohammed” approach; deposit on-budget coin seigniorage equal to that year’s trade deficit.
I think that boxes the compass. Unless we do one of these four things, future recoveries will be kneecapped whenever the budget deficit shrinks below the trade deficit.
@beowulf
Well now that’s interesting. Combine change in public debt with change in the CA balance,
http://research.stlouisfed.org/fred2/graph/fredgraph.png?&id=BOPBCAA_FYGFDPUB&scale=Left&range=Custom&cosd=1980-06-30&coed=2010-09-30&line_color=%230000ff&link_values=false&line_style=Solid&mark_type=NONE&mw=4&lw=1&ost=-99999&oet=99999&mma=0&fml=b-a&fq=Annual&fam=avg&fgst=lin&transformation=chg_chg&vintage_date=2011-12-23_2011-12-23&revision_date=2011-12-23_2011-12-23
And while the number doesn’t go negative in the late 00s, it does show a much slower increase.
Steve,
The most significant difference between 1929 and now, which Beowulf nicely sums up, is the balance of trade deficit. The US was the world’s largest net exporter then, and now we’re one of the largest net importers. I’m not discounting other differences, but if beowulf if right, in effect we could have deficit spent during the depression up to the amount of our balance of trade surplus, thereby accelerating the time line back to “full employment.”
The problem we are facing today, is that there is very strong deficit and debt reduction rhetoric/policy prescriptions being advocated by the powers that be in Washington.
I’d really like to see beowulf’s and Ashwin’s comments cross posted at AB, if that’s possible.
@nanute
I get that. But — see the link in comment above — (deficit spending – trade balance) did not result in net negative money flow to private sector in the late 2000s.
So, still an anomaly…
I don’t know if somebody has addressed the issue I am about to raise. According to Randy Wray, the Fed Bailout of the banks amounted to $26T. I am assuming that most of it was short term/overnight, but much of it was rolled over. The long term extension of such a debt – figures mentioned varies from $2T to $10T borrowed at 0% or close to it – Most of this money was very likely dumped by the banks into purchasing Tsy’s – shouldn’t these purchases of Tsy’s whether by domestic or foreign banks be backed out of the Federal Debt figures cited above?
It is possible that I am mistaken in my thought process. If so please point out where my thinking is flawed.
@Clonal Antibody
I’ve commented about this on his blog. That number is both cumulative and notional. Cumulative: Million-dollar, one-month loan, rolled over 12 times: $12 million. Notional: stocks that were available for loans but weren’t lent.
These are important numbers to know. But I think the peak outstanding was $1.2 trillion under all the programs?
Shouldn’t that be added to the debt figures, since we’re (sort of implicitly) talking about those figures representing new money fed into the economy, generated by deficit spending? (The bonds themselves are sort of a side-issue, until OMOs get involved.)
I’m not sure. Beo? In any case I think most of it’s been paid down?
From Treasury Direct
What are “off-budget surpluses?” It appears that an “off-budget surplus” increases the National Debt, the same as that done by an “on-budget deficit”
@Asymptosis
from A Citizen’s Guide to the Federal Budget
So it appears, that quite contrary to what is espoused, a decrease in Social Security payments will actually increase the National Debt.
I could also argue that when the banks paid back the loans, they added to the National Debt — for they would be counted as an off budget surplus. Could somebody tell me if I am wrong in m y interpretation? At least as far as these two documents go?
@Asymptosis
The Federal Reserve is like a duckbill platypus, its a govt agency that’s treated like a private sector entity.
It doesn’t pay taxes (+1 for “govt”) but its refund of earnings to Tsy are labeled miscellaneous receipts, just like when Verizon pays for an FCC spectrum license (+1 for “private sector”).
Fed-held Treasuries are govt property (since Tsy receives the interest, it holds equitable title as beneficial owner) and yet its counted in the Gross Public Debt Held By Public you linked to above (I know off-budget Agency debt is included in that measure and I’m pretty sure debt held by SS trust fund is not). Its a pretty confusing mess, I guess we should just be thankful that Fed liabilities aren’t counted against the debt ceiling.
Anyway, its not at all certain that “(deficit spending – trade balance) did not result in net negative money flow to private sector in the late 2000s”. Throughout 2007 for example, the Fed held over $700 billion in Treasuries. I’d argue your $200B net positive money flow should be subtracted by at least $700B since Fed savings more like govt savings than household, business (or foreign) savings… leaving a net negative money flow suspiciously close to the $500B+ private sector drain depicted in the sectoral balance chart.
Forgot to link to this table showing Fed’s week to week holdings of Tsy and Agency debt.
http://www.federalreserve.gov/releases/h41/hist/h41hist3.txt
Beo,
The separation between off-budget surplus, and on budget surplus is very puzzling to me. My interpretation of the National Debt is that it should equal the total available “Money Supply” to the economy – However, given the economy in a swoon, obviously this money is not reaching “Main Street” — So where is this money getting stuck? Is there double counting going on? Or, is there a shell game going on, in which, it just appears that there is a ballooning of the Money Supply, when no such thing is happening.
To me, at least, it appears that some items that are counting towards the National Debt should not be counted as such. What items could they be? Bank reserves, that have been inflated by the Fed Bailout? – These are meaningless, since we know that Bank Lending (which is what gets to Main Street) is not constrained by the level of Bank Reserves. So these Bank Reserves, that are held in the form of Tsy’s should they be left out of the calculation of National Debt?
What happens if we do this? My instinct is that you should see the dive in the Federal Debt that Asymptosis is writing about.
Correct me if my thinking is wrong.
Clonal, don’t mix up reserve accounts and securities account. To quote Jamie Galbraith’s admirably succinct explanation of central banking:
“When government spends or lends, it does so by adding numbers to private bank accounts. When it taxes, it marks those same accounts down. When it borrows, it shifts funds from a demand deposit (called a reserve account) to savings (called a securities account). And that for practical purposes is all there is”.
http://www.correntewire.com/jamie_galbaiths_%E2%80%9Cforeword%E2%80%9D_modern_money_commentary
Make of it what you will but the money supply (MZM) and debt level (publicly held debt) were pretty much the same–trend and size– from from 1980 to mid 90s; at which point money supply grew faster than debt until quite recently (To cite a chart from RSJ’s rather less succinct explanation of central banking).
http://tinyurl.com/7e4pecs
http://windyanabasis.wordpress.com/2011/03/28/leaving-modern-money-theory-on-the-table/
Beo,
What I find very interesting at the data in the Debt graph, is that it begins a decline right after the 1997 Asian financial crisis and the LTCM collapse that occurred soon thereafter. The decline steepens with the repeal of Glass Steagall, and continues till 9/11 and then rises again. Obviously, the bailout of LTCM did not sufficiently stem the decline of the National Debt. After 9/11, steps taken by the Fed and the US government caused the rise to resume and very suddenly at that.
I believe that whatever steps were taken after 9/11 is where the accounting shenanigans will be found. These steps may have been directly responsible for the 2008 collapse, and the continuing bailouts may no longer be working because, as opposed to 2001, the American 99% is no longer capable of carrying increasing bank debt.
So I do believe something has to be subtracted from the National Debt figures to give the real picture. But I do not know what. It is clear that the National Debt no longer reflects actual money in the hands of Joe Q. Public
“[W]hen it became clear to [G]eorge [B]ush that if [C]linton surpluses continued & our debt was [sic] paid down, the financial system would soon experience a dearth of safe assets & would freeze up;[sic]”
Right….
That Iraq thing turned out well too…
@Dave Raithel
Dave,
I share your pain.
But something was done post 9/11 that was much out of the ordinary. Whatever it was, only kicked the can down the road by 6 or so years. The bailouts of 2008 and 2009 have not even accomplished that much.
Post 9/11, some money reached the middle class by means of 2nd and 3rd mortgages, and little for the bottom 20%. The hunt for safe assets was already on! We had to hunt for a long time to raise money for a start up in 2003 and 2004 – but it was still possible. Today I am trying to raise funding for another start up — and the money just ain’t there!
Today the bottom 20% of pre 2008 has expanded to the bottom 40% – and really nothing there for the bottom 90% either! I don’t think that the actions post 1997 have prevented the depression. They have just extended and drawn it out!
@Clonal Antibody
“but something was done post 9/11…. I think that something was spending on Iraq and not counting it as part of the deficit. We had to pay for it, we just forgot to count it. What else have we been spending “off budget?”
@Clonal Antibody
Debt held by the public is the debt of the total, consolidated budget, including SS and Medicare trust funds. IOW, internal debts aren’t included.
Except (thanks, Beo): debt held by the Fed. I’d like to see consolidated consolidated numbers, subtracting debt held by the fed from debt held by the public.
The debt isn’t so much the issue in this post. It’s a measure of government deficit spending, which in MMT World is money creation. That’s what I’m trying to get to.
See Levy Institute “Strategic Analysis” papers, which give sector “balances.” (This usage bugs me because “balances” implies stocks, when they’re actually talking about flows. If you understand that it’s not a problem.)
@beowulf “Throughout 2007 for example, the Fed ***held*** over $700 billion in Treasuries. I’d argue your $200B net positive money flow should be subtracted by at least $700B”
Aren’t you subtracting a stock from a flow here? Need to look at *change* in Fed holdings of Treasuries?
“Aren’t you subtracting a stock from a flow here?”
No,publicly held debt is a stock and Fed-held debt is a stock as well.
So subtracting the latter from the former is still a stock (let’s call it public debt ex Fed, or PDEF)
By subtracting CA from PDEF, the trend of the flow stays the sum as your chart except that the nominal sums are approx $700B lower, On your chart we see private saving go from $500B to $200B in 2005 to 2007; if we had a PDEF – CA chart, we’d see private savings go from – $200B to – $500B. Since Fed savings aren’t really private sector savings, the chart would show domestic private savings go from underwater to even deeper underwater— there’s your flow.
“nominal sums are approx $700B lower”
Yes: the nominal *stock* is lower. But the flow is unaffected.
I like PDEF – CA. But we need to see change in the stock — the flow. Which I can put together easily. But:
That’s why I asked for help interpreting this:
http://research.stlouisfed.org/fred2/series/FDHBFRBN
(Hard to find definitions of these different measures out there — frustrating.)
It *looks* like the Fed sold $350 billion in bonds in late 2008, which by normal understandings is serious tightening. Really? Is that right? Or is this some kind of artifact of instituting IOR?
(This putting aside the question of whether swapping bonds for reserves at ZLB has much effect.)
Just need to be sure I’m choosing the right data series.
L. Randall Wray shows why the government deficit went down for a while as the private sector sucked up huge amounts of debt during the Clinton years. That huge sucking sound you may hear in the back ground in today’s financial sector is actually the release of the excrement piled up during the past fifteen to twenty years.
http://neweconomicperspectives.blogspot.com/2011/06/recent-usa-sectoral-balances-goldilocks.html
It is ironic that on June 29, 1999 the Wall Street Journal ran two long articles, one boasting that government surpluses would wipe out the national debt and add to national saving–and the other scratching its head wondering why private saving had gone negative. The caption to a graph showing personal saving and government deficits/surpluses proclaimed “As the government saves, people spendâ€. (The Wall Street Journal front page is reproduced below.) Almost no one at the time (or since!) recognized the necessary relation between these two that is implied by aggregate balance sheets. Since the economic slowdown that began at the end of 2000, the government balance sheet has reversed toward a deficit that reached 3.5% of GDP last quarter, while the private sector’s financial balance improved to a deficit of 1% of GDP. So long as the balance of payments deficit remains in the four-to-five percent of GDP range, a private sector surplus cannot be achieved until the federal budget’s deficit rises beyond 5% of GDP (as we’ll see in a moment, state and local government will continue to run aggregate surpluses, increasing the size of the necessary federal deficit). [I]n recession the private sector normally runs a surplus of at least 3% of GDP; given our trade deficit, this implies the federal budget deficit will rise to 7% or more if a deep recession is in store. At that point, the Wall Street Journal will no doubt chastise: “As the people save, the government spendsâ€, calling for a tighter fiscal stance to increase national saving!
Turning to the international sphere, it should be noted that US Goldilocks growth was not unique in its character. [P]ublic sector balances in most of the OECD nations tightened considerably in the past decade–at least in part due to attempts to tighten budgets in line with the Washington Consensus (and for Euroland, in line with the dictates of Maastricht criteria). (Japan, of course, stands out as the glaring exception–it ran large budget surpluses at the end of the 1980s before collapsing into a prolonged recession that wiped out government revenue and resulted in a government deficit of nearly 9% of GDP.) Tighter public balances implied deterioration of private sector balances. Except for the case of nations that could run trade surpluses, the tighter fiscal stances around the world necessarily implied more fragile private sector balances. Indeed, Canada, the UK and Australia all achieved private sector deficits at some point near the beginning of the new millennium. (Source: L. Randall Wray, “The Perfect Fiscal Storm†2002, available at http://www.epicoalition.org/docs/perfect_fiscal_storm.htm)
[…] raise them, and B) if deficit spending is not sufficient to match the increases in fixed assets, depressions result, and the “fiscally responsible” leaders get voted […]
@Clonal Antibody
I think what happened was something I rarely see mentioned anywhere. I really think during bubbles, things other than money become “money-like”.
The national housing bubble looks like it started in roughly 2004, but that’s only because we’re looking at absolute numbers, and only at a national level.
By 1999, chicago and other major cities had areas where houses were going up 15% a year. We don’t see it in the charts or graphs because it wasn’t widespread across the entire city.
But this class of people were making money, making money on real estate, and spending there ass off.
This caused a mini-boom in the major cities. If you compare chicago 1995 – even the nice areas – to chicago 2010, it’s not even close to the same city. Old town, lincoln park, wrigleyville, wicker park. These areas were horrible in the 1990s compared to their opulence today.
I say the housing bubble started in 2001, when Greenspan cut rates and kept them pegged very low for several years.
By the time we see the bubble show up, it had been raging for 5 years for top 10% ers.
Since this demographic controls a huge amount of the discrestionary spending, they were able to support the economy. If you look at job growth during that time, it was anemic.
@TC
So you’re saying, counterfactual: the current “troubles” *would have* happened in ’01 with the dot bomb (continuing the historical pattern of depressions following declines in public debt), but that this time historically exceptional quantities of private debt kept things floating/inflated for seven years?
Seems sensible, much what I said above:
But I’m trying to figure out how to demonstrate it in a graph. I did find some numbers on bank credit outstanding in the ’20s at one point…
http://www.asymptosis.com/banks-who-needs-em.html
But the series only goes back to 1896, which gives us only one other depression to compare to: ’29.
[…] while back I pointed to (and demonstrated with not very pretty pictures) Randall Wray’s rather stunning observation: […]