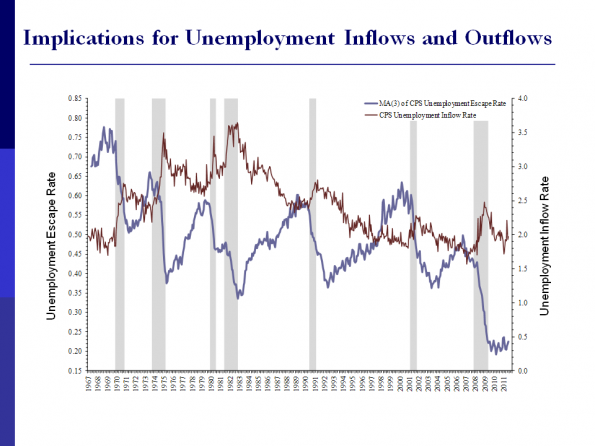
I find the following graph singularly depressing. It shows the chances of becoming unemployed (red), and the chances of exiting unemployment (blue), since 1967.
The odds of becoming unemployed today are basically identical to 1967.
The probability of exiting unemployment — the “escape rate” — has plummeted over that period. (Though it was roughly flat to slightly declining — with large variations — from the mid 70s to the mid 00s.)
FT Alphaville » The decline of US labour market dynamism, secular and cyclical.