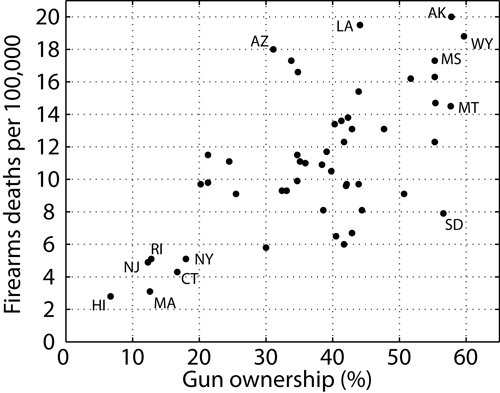
The other day I looked at number of guns versus number of gun deaths by country, in countries like ours that have pretty good rule of law. The correlation is pretty clear: more guns, more gun deaths.
But I was also wondering about correlation within the U.S., by state. I’m pleased to find that Sam Wang’s got it:
I’d say that great minds think alike, but really: Sam — a professor at Princeton — has got it all over me when it comes to drawing valid conclusions from statistical data.* For instance: like Nate Silver, he called every state correctly in the recent presidential election. But his stated confidence level was way above Nate’s — between a 99.2 and 100% chance that Obama would be re-elected. That’s putting your reputation where your predictions are.
Read Sam’s post and the one preceding it. He makes all sorts of sense. He also gives us the sources, so I thought I’d show the data a couple of other ways. How about…red states vs blue states? Here you go:
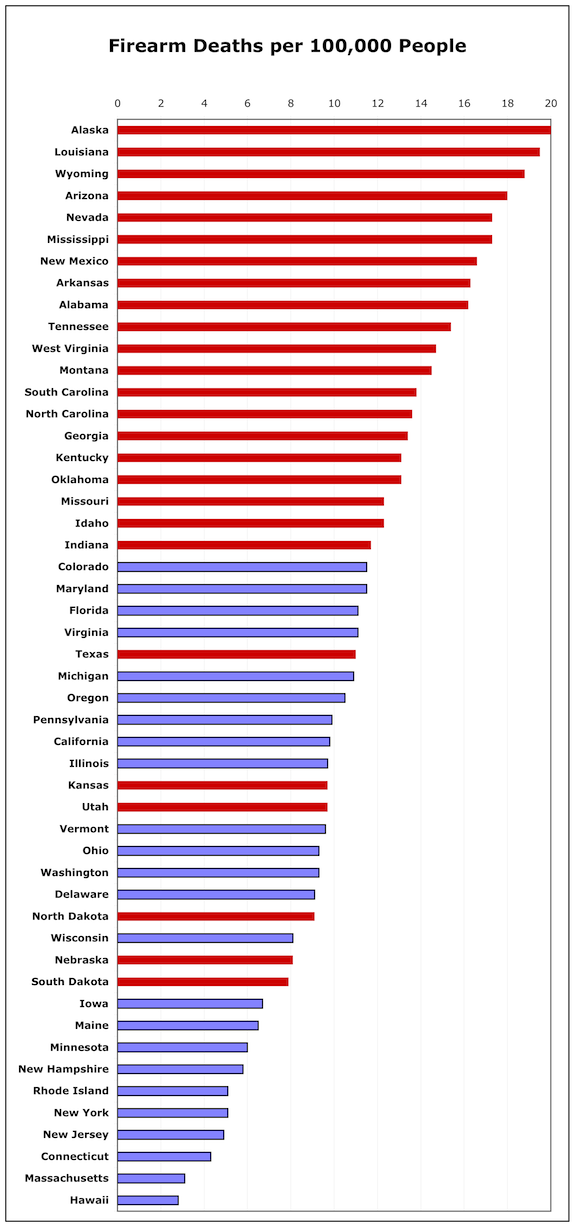
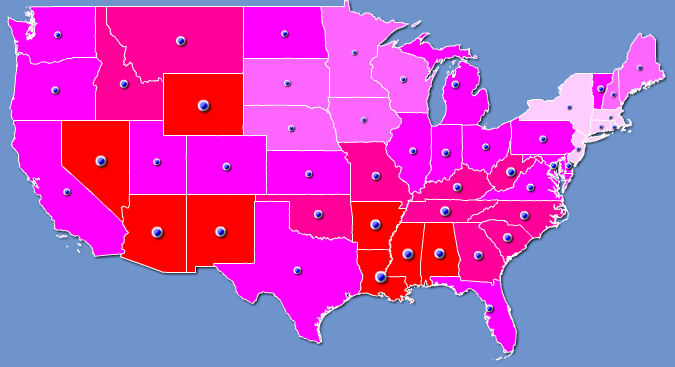
Does anyone see a pattern here? Here it is on a map:
Though I find that Richard Florida has beat me to it on this one:

You can quibble all you want about correlation and causation, but the simple fact is: if you live in a red state the odds of your children dying of gun violence is 75% higher than if you live in a blue state.
That may help explain why, when Americans vote with their feet and choose where to live, only 38% vote for red states.
It may also help explain why people in red states want guns so much: it’s dangerous to live in a red state. They’ve got all those guns.
I’m still asking: would you rather “feel” safe, or would you rather be safe?
* “Prof. Sam Wang‘s academic specialties are biophysics and neuroscience. In these fields he uses probability and statistics to analyze complex experimental data, and has published many papers using these approaches. He is also the author of Welcome To Your Brain, a popular book about his field.”
Cross-posted at Angry Bear.
Comments
16 responses to “Guns and Gun Deaths, State by State”
You suspiciously left out suicides, police shootings and justifiable defense shootings in your death numbers…hmmmm…wonder why. Sorry, not fooled.
Dave is completely correct. I’ve looked at the correlation between homicide rate and gun ownership as a percent of the population and there is absolutely none.
Sources:
http://www.deathpenaltyinfo.org/murder-rates-nationally-and-state
http://www.washingtonpost.com/wp-srv/health/interactives/guns/ownership.html
Therefore it seems your data is being driven largely by suicides. So yes, if you are suicidal guns are dangerous to you…
Shouldn’t New Mexico be a blue state?
Nevada (5th worse) is listed as red. It’s blue.
Why don’t you try this on a county by county map and not state by state. Parts of Illinois match ND etc. Gun crime rates don’t break out in state brackets but probably in urbanization brackets. You also assume that the US has homogeneous population groups. It certainly does not. You have not accounted for or normalized these factors. Any gun control policy will affect each demographic group differently. It may not make any difference in some areas, but in others it would lead to devastating violence and brazen gang warfare. This gets a B for a first course in demographics and a C- for an Upper level course.
@Reynald Lescarbeau
@Reynald Lescarbeau
So , by your logic, there are many more suicidal types in red states. Does this suggest that more crazies tend to be red staters?
“Regardless???” of causation…??? You’ve got to be kidding… and then to top it all off…
You “Conclude” that “…if you live in a red state the odds of your children dying of gun violence is 75% higher than if you live in a blue state.” What kind of statistical analyst are you anyway…??? …even if you obviously incorrectly “labeled” several states ‘red’ vs ‘blue’…
Your real “POLITICAL” leanings were exposed by your statement “the simple fact is: ” which was a dead giveaway…
Peaceful yet Prepared
So what happened in Conn., a blue state.
If you are going to make statements such as, “…if you live in a red state the odds of your children dying of gun violence is 75% higher than if you live in a blue state,” please at least provide the statistics to show the murder rate of children by gun violence in each state, rather than trying to scare people into thinking that their children are in serious danger if they live in a red state.
P.S. Connecticut (Sandy Hook) is a blue state. Colorado (Columbine) is a blue state. Virginia (Virginia Tech) is a blue state. Pennsylvania (Amish schoolhouse) is a blue state.
Those are the most talked about school shootings that I can remember in the past decade or so. Why did they all occur in blue states?
Oh, and the Aurora movie theater shooting was in Colorado too.
@ Nedster …Columbine occured when Colorado was red as did the Chucky Cheese shootings in Aurora back in 1994. Your insinuation that the Electoral votes correlate to firearms ordinances doesn’t hold water. The Traveler’s Guide to the Firearms Laws of the Fifty States ranks Colorado’s gun laws as very favorable to firearms owners. Open carry is allowed throughout most of the state including Aurora and Arapahoe County, and concealed carry is shall issue. Just because the state went for Obama in 2008 and 2012 does not mean much; Colorado is a battleground state for both parties.
Also, Arizona, a sólida red state is even more lenient regarding ownership and carrying of firearms and was the site of the public shooting by Jared Loughner lastn year.
And where is the overlay map of average income per capita?
The data on the first graph shows a scatter effect with little or no value.Not to mention it is inclusive of non murder gun deaths(suicide etc) however we need to look at the overall methods of murder.We can stop these acts if we take away guns,knives,iron pipes,2×4’s,fist and other potential lethal weapons.As long as there are multiple people living on this planet there will be murder.The best i can think of to deter it is teaching our children to care more about people than material things. Maybe in a few houndred yrs we can get away from this (keeep up with the Joneses attitude)that steals so much from our families and leaves people empty and unfeeling.
Perhaps a better analysis, if more difficult, would be to run the numbers by Congressional District. While many factors would vary, the populations would be relatively equal. One could then identify by the representative’s party affiliation. Or not, depending on if one wants to properly make a comparison or just a flawed political statement. As it is, low population states have their numbers moved substantially by a few incidents and large population states with localized high crime areas (say parts of Chicago or Los Angeles) don’t. The Connecticut shooting would move a small state perhaps as much as 4 per 100,000, and it’s a blip for Illinois or California.
Of course the idea that we are a law-abiding nation is hard to take realistically when one looks at the devastation caused by the demand for illegal drugs, the overt disdain for traffic speed limits (which do have a positive effect, if followed, on safety, gas mileage, etc.), and makes laughable the idea that if non-lawbreakers turn in guns, lawbreakers will stop breaking laws.
These graphs are completely bogus. For starters Nevada and New Mexico are blue States and have been for several election cycles. The “Gun Deaths per 100,000” should be normalized to eliminate the dilution in large population states. Publish a graph that shows gun deaths by State and see how much blue is at the top.
Until whichever “expert” who assembled this study is willing to include gun ownership per 100,000 for each state as it relates to the number of deaths in CRIMINAL incidents involving firearms– murder, attempted murder, assault w/ deadly weapon– this study will not be taken seriously by any objective reader.
@David – are you suggesting that people killed in noncriminal gun violence are somehow less dead than those killed in criminal activity? Accidental and suicide deaths are still deaths, and if the presence of firearms increases those deaths the data is significant.