No, I’m not commenting on their sexual mores. I’m talking swing voters.
A new study (PDF) by Joe Stone and Steve Hayes suggests that most or all of the market-crash-fueled movement to Obama in these closing weeks is likely to be in rich states. If you’re thinking battlegrounds/close contests, that means Colorado, Virgina, and Nevada. (Here’s Wikipedia’s list of states by GDP per capita.)
You can get an excerpt and some discussion of the paper from Mark Thoma’s site. I’ve highlighted the strong/significant vote influencers on the regression table and posted it here.
But first, what I know you all really want–the prediction:
As of September 17, when they ran the numbers, they projected Obama with 50.14%–with a margin of error of 1.58%, a statistical dead heat. (They’re not counting electoral votes, just the popular vote. Based on McCain’s many wasted votes–taking 62% in Oklahoma doesn’t help him any–a 50.14% result would almost certainly deliver a strong Obama electoral win.)
But Thoma re-runs their equations for October 22–after the stock-market dive: “if they redid them today the aggregate estimates predict a 4 percentage point win for Obama.” (Which I guess means 52/48, presumably with a similar MOE. Translated into electoral votes, that’s huge.)
Background: Economists have been developing and fine-tuning economics-based presidential win-prediction models for years. Here’s the most basic form of the model, comparing the incumbent party’s win percentage to GDP/capita growth in the first half of each election year.
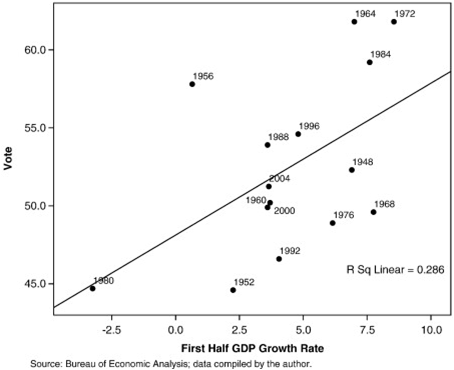
There’s obviously a strong correlation, but there are far too many outliers (like, most of them) to make a prediction on any individual election.
Haynes and Stone (and their many predecessors, cited in the article) have added a bunch of other variables to improve the model’s predictive power:
- What party’s in power?
- How long have they been in power?
- What’s the Dow done since the start of the election year?
- What was the GDP growth percentage in the second and third quarters?
- How has the percent of Americans in uniform changed in the two years before the election?
- How has defense/security spending (as a percent of the budget) changed in the two years before the election?
By the authors’ calculations, these factors accounted for between 55% and 75% of the incumbent party’s percentage variance over 23 elections.
Far more intesting than the baseline results, though, is their application of the model to five tiers of states, divided by GDP per capita.
Short story, over the course of 23 presidential elections:
- In poor states, the only strong win predictor is GDP growth. And it’s not a terribly strong correlation. But as Mark Thoma says, “Voters in the lower income states only care about real GDP growth.”
- In rich states, several of the variables have a statistically significant impact on voting decsions. The big correlations are (in increasing order of impact) the incumbent’s party, the performance of the Dow, and the two-year change in security/military spending.
Only one of these variables has changed much recently–the Dow–and it’s changed a lot. So you should expect a lot of market-driven movement in the twenty states with the highest per-capita incomes. Again, think Colorado, Virgina, and Nevada.
But what about Pennsylvania? Even though Obama seems to own it at this point (and his lead’s increasing fast), McCain is making a big play for it cause it straddles his only plausible path to victory.
Pennsylvania is 28th on Wikipedia’s rich-states list. According to Stone and Hayes’ analysis, among the factors they looked at, the only ones that stand to move Pennsylvania voters much are the incumbent’s party (that’s not gonna change) and the two-year change in military spending (ditto). IOW, don’t expect much change based on the stock market.
This is all in keeping with the work done by Larry Bartels and Andrew Gelman showing that rich people in poor states are the ones most strongly influenced by “social” issues. In rich states, those issues don’t have nearly as much traction with either rich or poor.
It seems that what does have pull in rich states is–only somewhat surprisingly–the status of people’s stock portfolios.
Oh and of course, I should probably include here the authors’ obligatory cautionary footnote:
Every election includes idiosyncratic determinants unique to that election. For the 2008 election, these would in part include the race and gender of the candidates, Black turnout, new voter registration, and the financial crisis of fall 2008 (beyond its direct impact on the economic regressors in the model). Of course, no model, no matter how elaborate, can fully capture in advance all factors that influence voters the day of the election.