My gentle readers who have followed me over time will have seen this graph and statement far too many times by now:
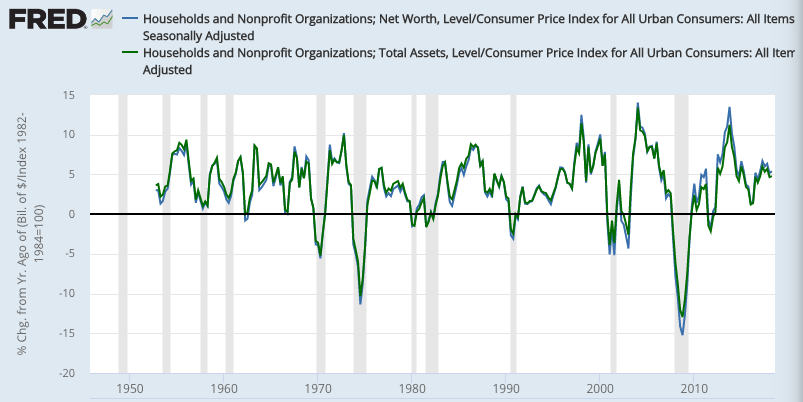
Since 1970 in the U.S., (almost) every time you saw a year-over-year decline in real household assets or net worth, you were either just into or about to be into a recession.* It’s seven for seven. Though to be fair: there have been two recent false positives, following the 2000 and 2008 recessions. So nine for seven. But interestingly, David Andolfatto and Neil Irwin have pointed to 2012/13 and 2015/16 as “mini” or “invisible” recessions. Ditto the weak GDP growth in 2002?
In any case, it’s a pretty impressive track record of predicting recessions. The apparent takeaway: when people (suddenly) have less wealth, they spend less. Seems plausible.**
But I’ve long meant to look at this relationship more systematically: what’s the correlation between changes in real household wealth, and spending in the economy? In particular: is the correlation concurrent, or is there a lag? Do you see greater correlations with spending changes one, two, or four quarters after a wealth change? Or: earlier? Do spending changes precede wealth changes? Post hoc ergo propter hoc?
Or: which came first? The chicken or the egg? Looking at wealth and spending changes (for example), which one looks like the dependent variable, which the independent?
I had no real idea what results I’d see. This was pure curiosity.
I’ll start with the results. But one key explanation first: the “spending” measure in these graphs seeks to capture spending that households and firms have the discretion to change over short periods; it excludes housing and health spending — a great deal of which is spending by other parties, imputed to households in the national accounts (see Cynamon and Fazzari, below). It also excludes spending on new structures by firms, which involves long-term decision-making.
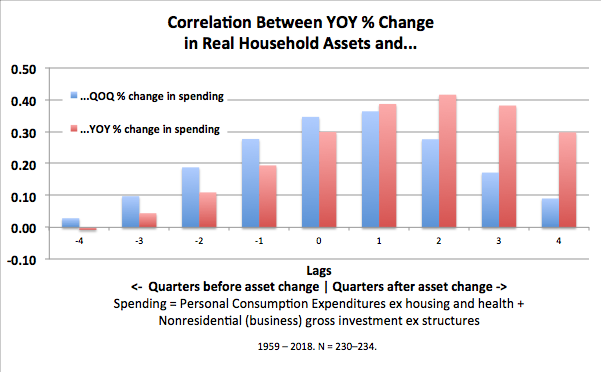
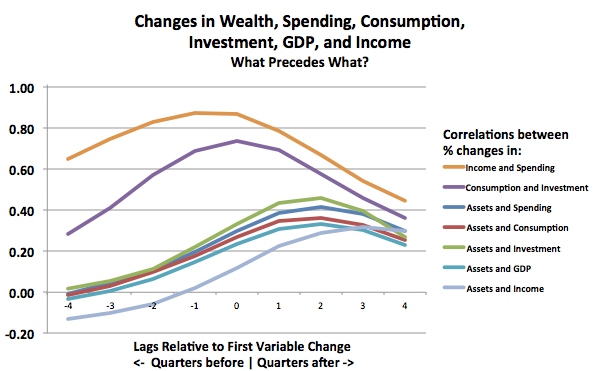
For the year-over-year series, bigger bars on the right. Wealth changes correlate (much more) with spending changes in later quarters. You can also read this in reverse: Changes in spending don’t correlate as much with ensuing wealth changes.
It seems especially notable: Changes in spending actually show a negative correlation with changes in wealth a year later. The naive takeaway — higher spending “causes” less wealth increase and lower spending causes more — should probably be eschewed. But…what’s with that?
The quarter-on-quarter changes show much less of a pattern than year-on-year, in both this graph and all the ensuing — perhaps just due to more random variation in the quarterly series. I’ll just show year-on-year in the following graphs, to remove clutter. (This means there’s overlap; in the +1 and -1 lags, for instance, the YOY change-in-wealth measure has a three-quarter overlap with the change-in-spending measure. +4 and -4 have no overlap.)
It would be great to see this graph elaborated, somehow depicting the correlations for wealth/asset-market runups versus downturns. I would expect higher correlations for the downturns, since they generally happen so much faster and so would have fast impact on spending.
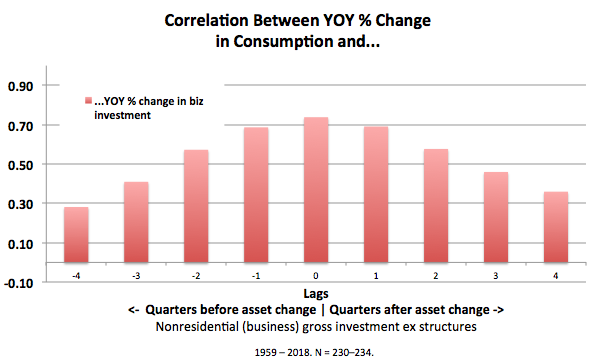
The spending measure here includes both consumption and investment spending. Which type of spending seems to respond more to wealth changes?
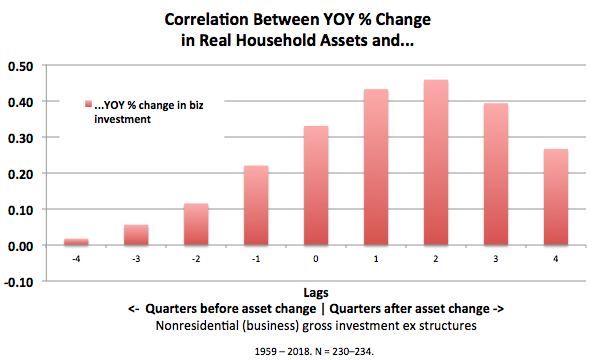
The overall pattern is the same. But if wealth changes do affect spending, the effect seems to be greater on investment spending. (Though investment spending is of course only about 20% of total spending — 15–20% in this discretionary spending measure.)
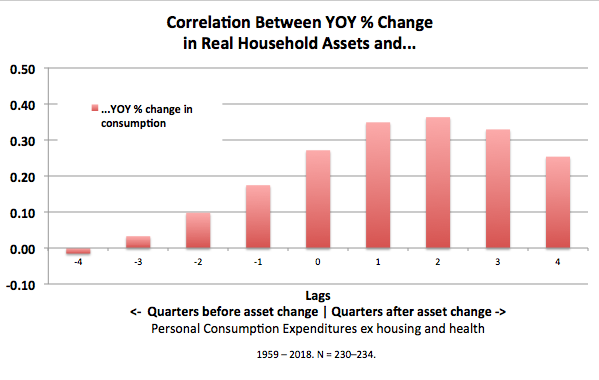
Next, just for reference: by this method, consumption and investment spending seem to move together, concurrently. (Note the Y axis change below; perhaps not surprisingly, these are far bigger correlations.)
More curiosity: do we see the same apparent wealth effect on GDP that we do on spending?
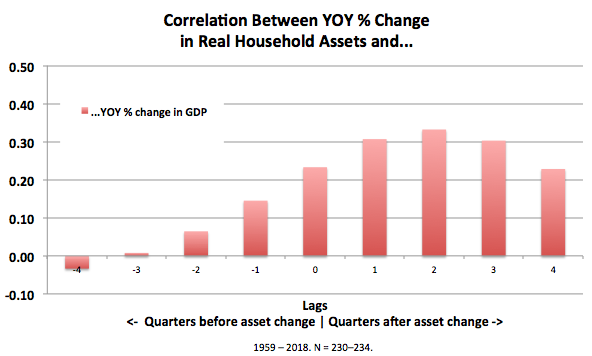
Again the pattern’s similar. We even see the same negative correlation between GDP changes and wealth changes a year later. But the correlations are much lower. Not surprising: much of the spending that comprises GDP is not amenable to short-term discretionary changes by households, firms, and government.
For comparison: what kind of correlations do we see between changes in personal income and spending?
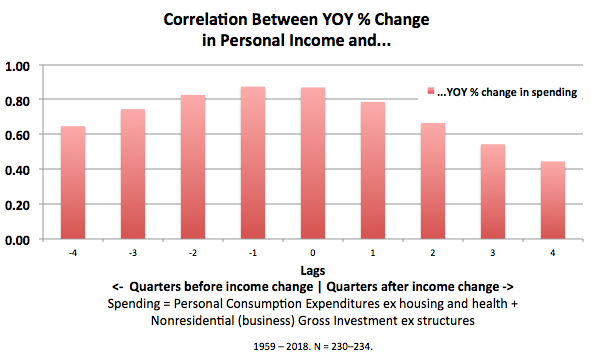
The correlations are high (note the Y axis) and strongly positive throughout. But the pattern is opposite to the apparent real wealth effect we saw above. Income changes have a weak(er) correlation with ensuing changes in spending. Put another way, spending changes tend to precede income changes, more than the reverse.
Finally, closing the loop, wealth changes vs income changes. This is a surprising result.
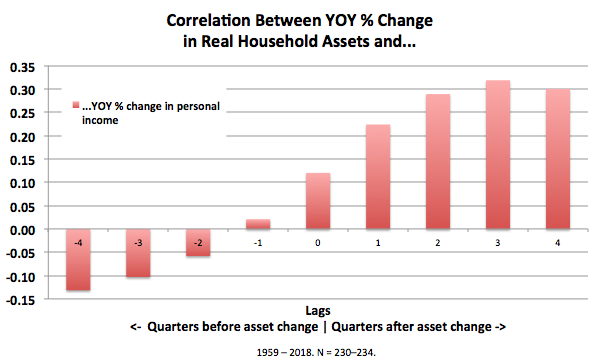
Note that personal income does not include asset-price-driven capital gains and losses, which are the prime movers in short-term wealth changes. So we’re comparing very different measures here.
The correlations are smaller than we’ve seen, but the left-to-right gradient shows big differences. Wealth changes correlate with ensuing income changes, but income changes have a negative correlation with ensuing wealth changes. Do with that what you will.
Knowing you’ll want to collect the whole set, here are all of these graphs combined into one.
The spreadsheet’s here. It’s pretty easy to add your own data series to compare other measures. It would also be great to see longer periods; the almost sixty-year data set might suffice for five-year lags?
Wealth, Consumption, and Spending
I can’t resist adding an overall comment on mainstream economics and economic modeling, which I think is pertinent to all this: it seems crazy to me that Keynes’ consumption function:
1. Isn’t a spending function. The proportion of spending that goes to consumption vs investment is arguably an important thing to look at, but it’s secondary and peripheral to the larger question of aggregate demand, or more aptly, aggregate expenditure. Or just…”spending.” So in addition to the never-ending befuddled saving-investment confusion that Keynes has delivered unto us (oh: “desired” saving and investment), the whole Keynesian “investment-led recovery” construct promulgates and participates in reifying the pervasive and pernicious mythos of noble, job-creating “investors.”
2. There’s no wealth term, or function, in the consumption (spending) function — something that’s SOP in advanced Godley/Lavoie-style stock-flow consistent (SFC) models such as this great one from Michalis Nikiforos, Genarro Zezza, and Marshall Steinbaum. There’s only an income term. Rather, econs bolt the rather gimcracky contraption of “budget constraints” onto the back end of their models. KISS.
Credit Where Due
This correlations approach comparing positive and negative lags is inspired by Arindrajit Dube’s, in his magisterial takedown of Reinhart and Rogoff’s sophomoric “government debt causes slow growth” claptrap. (Though his statistical sophistication vastly surpasses the freshmanic effort you see here.)
Further inspiration came from Roger Farmer’s article, “The Stock Market Crash Really Did Cause the Great Recession.” The work here perhaps generalizes the asset/wealth effect implicitly bruited in that title, and helps demonstrate it over a long period and multiple recessions.
The “discretionary” spending measure used here is inspired by the work of Barry Cynamon and Steven Fazzari (viz), deconstructing personal consumption expenditure measures to exclude imputed spending and etc. Hat tip to J. W. Mason for pointing me their way. I actually have an older spending/consumption series of theirs to hand, but only annual. A more recent and quarterly version could quite easily replace the consumption-spending series here.
The temerity to write this post — including its implicit assertion that in reality the monetary/financial economy (here: asset-price-driven wealth changes) is what drives the real economy (recessions) — owes much to a great tweet by Sri Thiruvadanthai:
Contra neoclassical econ money/finance are not epiphenomena but they are the real deal and the real economy is the epiphenomenon!
Also thanks to Jason Smith for his comments on Twitter. Thread.
To all my other interlocutors: many thanks.
* Interestingly, adding liabilities to assets, to derive net worth, adds no predictive value. This is perhaps not surprising; household liabilities are only about 15% of household assets, and they change slowly or in other words not much, compared to changes from asset-price runups and especially drawdowns.
** It’s also very much in keeping with Kahneman and Tversky’s Prospect Theory: people are especially sensitive and responsive to losses. So it seems plausible that this is a real economic effect driven by real human behavioral reactions. (Microfoundations!)