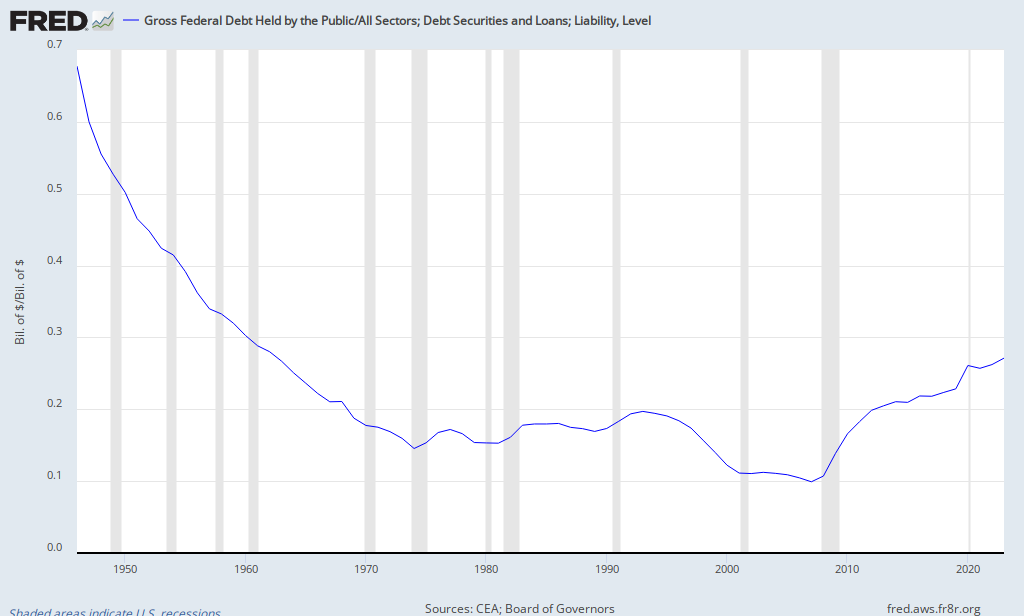
Poking around in FRED while thinking about money created by banks and by government, I came up with the following graph, which I found to be pretty eye-popping:
Federal Debt Held by the Public as a Percentage of Total Credit Market Debt Owed

That’s a pretty profound secular shift. But far from delivering any obvious conclusions for me, it raises several questions.
• First, what’s included in TCMDO? (Is there a glossary of these measures available somewhere? I haven’t been able to find one.) I assume government bills and bonds are included — including those held by the Fed. I assume it does not include bonds held by the Social Security trust fund — nonpublic debt. (Or does it?)
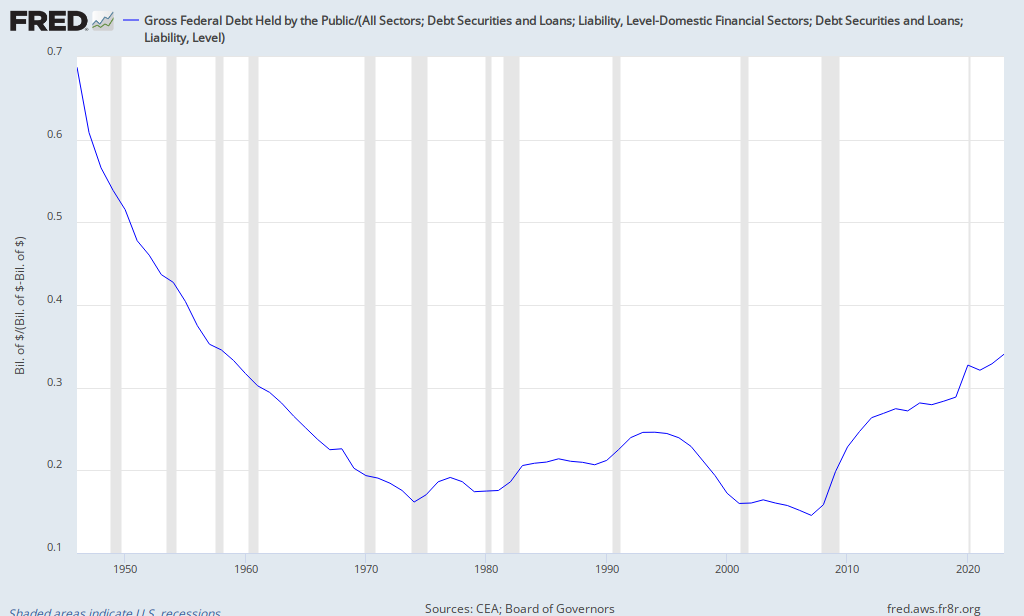
• Since financial industry debt is “different,” what does the graph look like if we exclude that?
Federal Debt Held by the Public as a Percentage of (Total Credit Market Debt Owed – Financial Sector Debt Owed)

• Should we adjust for credit-market instruments held by the Fed?
• Are there more illuminating measures to display in this graph?
• What does this say about the stock of “safe assets” in the economy?
• How does this relate to JKH and Steve Waldman’s notions of government money (created through deficit spending) as “leverage” — in Michael Sankowski’s words: “JKH points out (S-I) is like the denominator in leverage. When (S-I) [govt deficit spending plus/minus trade imbalance] gets too small compared to S or I, then the private sector steps in with private creation of S. But these claims aren’t always as credible as government NFA. Plus, private sector S can sometimes be marked to market in ways which makes valuation difficult.”
Sorry to be so inconclusive. As always I’m hoping to be educated by finer minds than mine.
Cross-posted at Angry Bear.
Comments
20 responses to “Public vs. Private Debt: The Long View”
[…] Cross-posted at Asymptosis. […]
[…] Cross-posted at Asymptosis. […]
Your mind is fine.
@paulie46
Creepy but agreed.
Is federal debt held by the public a close approximation of private domestic sector NFA?
@paulie46
Thanks, you’re very kind. That’s about how I rate it, too.
@wh10 “Is federal debt held by the public a close approximation of private domestic sector NFA?”
According to MMTers, it should be.
@Asymptosis
Or: it should be, adjusted for the cumulative trade surplus/deficit.
“First, what’s included in TCMDO?”
see here:
http://newarthurianeconomics.blogspot.com/2011/07/bagging-groceries.html
“I assume government bills and bonds are included — including those held by the Fed. I assume it does not include bonds held by the Social Security trust fund — nonpublic debt.”
Correct. TCMDO includes about 10 trillion of the 14+ trillion Federal debt. I think the reason for this is in the series name: Total Credit Market Debt Owed.
@The Arthurian
Thanks! Nice deconstruction.
So what do you think accounts for the precipitous decline, ’50-’75?
@Asymptosis
You don’t think it was the massive WWII deficit spending?
@wh10
at least in part. does seem way drastic though.
Massive WWII spending pushed the Federal debt up while the private sector was deleveraging… the private sector was probably helped by the Federal expansion of debt.
After the war, people had lots of spending money and little debt. This made them the perfect customers. And the result was a golden age of economic growth.
And since we use credit for growth, private debt expanded like crazy, and the Federal debt shriveled by comparison.
By the late 1960s, the debt burden was starting to hinder growth. And the fit hit the shan with the 1974 recession.
@The Arthurian
A better explanation for The Great Stagnation?
I think so, yes. The cost of finance reduces profits to the non-financial sector and reduces aggregate demand. Both of these effects hinder growth. Since 1974 or before — since the mid-1960s, I think — the cost of debt has hindered growth.
And policymakers’ solutions always call for additional credit use. So the problem persists.
Why is it we call the productive sector non-financial? Shouldn’t we instead call the financial sector non-productive?
Hi Steve,
re the quote, I corrected Mike on that as follows:
http://monetaryrealism.com/a-reply-to-winterspeak/#comment-1569
“So I’d say (S – I) leverages the amount of S required to fund I.”
i.e. (S – I) is the numerator, in my view
sorry, no time to comment otherwise right now
@wh10
Massive WWII spending pushed the National Debt to ~$270 Billion – less than 3% of the current outstanding debt.
@wh10
A lot of the WWII debt was simply bought up by the Fed (in order to maintain T-bill peg of 0.375% and T-bond peg of 2.5%). Because of the net earning rebate to Tsy, Fed-held debt is pretty much the same economically as Tsy just spending the dollars into creation (like Lincoln’s greenbacks during the Civil War).
Remember also, the eight war bond drives were, in all but name, a compulsory savings plan (bond purchases were incorporated into the new income tax withholding system). War bonds drained AD during the wartime boom, and then their post-war redemptions injected AD into the postwar slump. Naturally, the idea was Keynes’s (in his 1940 pamphlet, How to Pay for The War).
[…] Asymptosis » Public vs. Private Debt: The Long View […]
@Asymptosis
The best place I know to see this broken down all in one place is the Fed’s Z.1 flow of funds:
http://www.federalreserve.gov/releases/z1/current/accessible/l1.htm
@BCG81
Thanks BCG81. As I said to Jim over at AB, Line 8 of Table L-1 does not give a breakout of which federal government liabilities are included. The levels (as suggested by Bruce over there) suggest that intragovernmental liabilities are not included.