The big coronavirus stimulus programs are helicopter-dropping trillions of dollars in assets into households’ (and firms’) accounts, onto their balance sheets — all those assets created ab nihilo by government deficit spending.
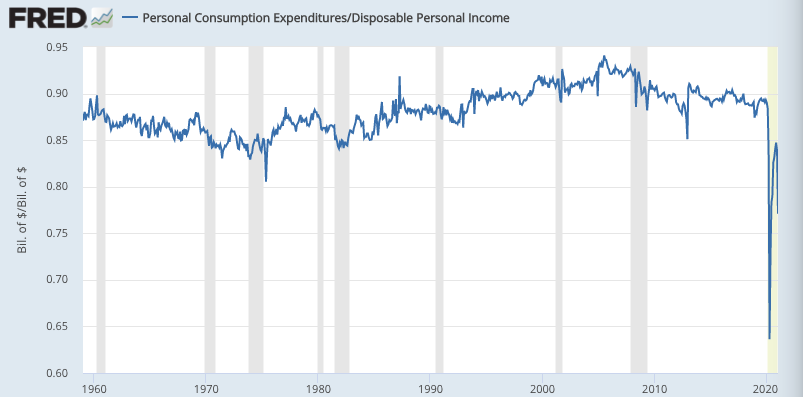
But as many are pointing out, households aren’t turning over many of those assets in spending, buying things — transferring the assets to firms in exchange for newly produced goods and services. The Personal Saving Rate — saving, or holding relative to income, divided by (disposable) income — has skyrocketed.
In simpler terms, spending as a percent of income has plummeted.

A Twitter post by our new Deputy Assistant Secretary for Macroeconomics at Treasury Neil Mehrotra raises exactly the question that comes to my mind:
It would be nice to articulate what exactly is the downside is of making transfers that are saved . . .
The short answer, of course, is that households’ failure to immediately turn over their new assets in spending will fail to stimulate economic activity — producers creating goods and services: giving massages, preparing meals, producing cars and cell phones — and presumably hiring more people to do that production.
But will households start spending those assets when things open up?
That immediately got me thinking about WWII and ensuing, when the same thing happened though in somewhat different form: households were hoarding their income, holding onto their assets, like they are now (saving rates were in the mid-20% range 1942-44). Meanwhile both households and firms were getting a lot of their income/revenue from wartime government deficit spending — paying soldiers and arms producers. The household sector was piling up those magically created new assets, and not turning them over, transferring them to firms in spending.
Which all reminded me of this old post by GMU economist David Henderson: “Does Drawdown of Savings Explain the Postwar Miracle?” He pooh-poohs the idea that postwar households were “spending down their savings,” because while saving rates declined (9.5% in ’46, 4.3% in ’47), they didn’t go negative.
Which highlights the fundamental problem with (especially Right) economists’ quasi-Calvinistic “saving rate” obsession: that measure has both a numerator and a denominator, which both involve income (saving is just a residual: income minus spending). Note that the spending graph above doesn’t have that problem.
And the two are causally connected. When postwar households started spending out of their accumulated stock of assets, causing firms to produce more consumer goods, firms inevitably hired more to produce those goods — increasing households’ aggregate income. (While firms’ revenue sources shifted from government deficit spending to household spending turnover.) So the “saving rate” didn’t go negative because the resulting income increase kept it positive.
In other words, Henderson’s “saving rate” framing is an error of composition (or a partial-equilibrium error); it considers saving as a percent of income, without considering that higher spending causes higher income. Households were spending out of their assets at a higher rate, postwar — the lower saving rates clearly suggest that — even as higher wage bills paid by firms were funneling (a lot of) those assets right back to the household sector as income.
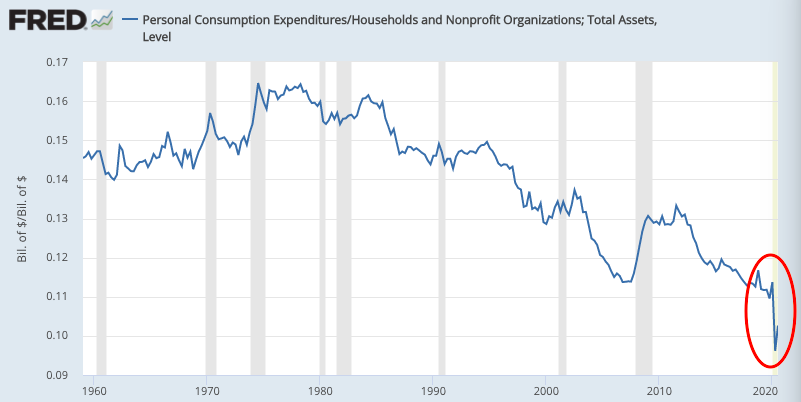
We can perceive that today by looking at the sudden decline in household spending as a percent of assets, spending velocity; the numerator (spending) declined a lot, while the denominator (assets) increased a bit:

Fiscal policy is kinda pushing on a string. But we should probably expect a postwar-style dynamic to play out over the rest of this year, and beyond. Households have more assets; if (when?) velocity returns to pre-crisis levels, they’ll start turning those over in spending.
And we should remember that the big postwar jump in household spending/asset turnover didn’t translate into significant, sustained inflation for another three decades — excluding the war years, the only significant and sustained inflation episode we’ve seen in the last ninety years. (Extra credit: count the recessions over that period.)
Comments
4 responses to “Savings Glut? “Households are Just Saving all that New Money!”
Are we overlooking the fact that many of the places where one would spend money are closed or on reduced service?
But will households start spending those assets when things open up? is the right question…what will have changed in how people think about money and how they use it as a result of 2020? What do people need to buy besides food? This isn’t the postwar era where new and previously unimaginable products were coming out all the time.
Paul: I get what you’re saying, but I’m thinking there’s a lot of untapped spending desire out there. Closures may dampen spending some, but I’m thinking people will find venues that are still offering…
I wonder how much information is lost by looking at things in the aggregate. Numbers for 2020 seem to show that goods consumption hasn’t really changed much at all. What is down is services. In general, people won’t consume deferred services (you’re not going to make up missed haircuts or dentist cleaning visits). You may go out to eat a bit more than normal, but you can’t make up for a year’s worth of dining in.
I also wonder whether the savings represent that lost service consumption among those who are well off. The wealthy are wealthy because they don’t spend all their income. Sure, everyone may take a deferred vacation, but that doesn’t seem like a long-lasting event. If we know *who* was saving, we’d have a better handle on what might happen in the future.
@Andrew
Great question. Thinking in terms of poorer vs richer and their likelihood to spend out of new “savings,” I’m drumming my fingers waiting for the DFA asset and wealth #s for Q4. Should be out in the next couple of days.
My impression is most of the wealth increase is at the top (no surprise…), which would mute the “release” effect somewhat when people can spend again out in the world.