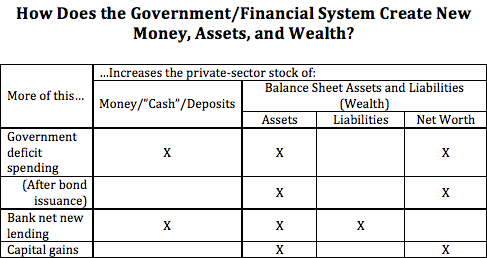
Our standard measure of production, GDP, doesn’t even come close to explaining the accumulated wealth of nations.
How productive are we? How much stuff do we produce for every hour we work? It’s one of the central questions of economics, and per many economists, productivity growth is the ultimate determinant of our world’s centuries-long increase in material well-being. If we increase that ratio we can work less, or have more stuff, or some of each. Here’s what that measure looks like post-war.
By this measure (here in 2012 inflation-adjusted dollars), today we produce $73 worth of stuff for every hour we work, compared to $21 in 1948 — a 3.5x improvement.
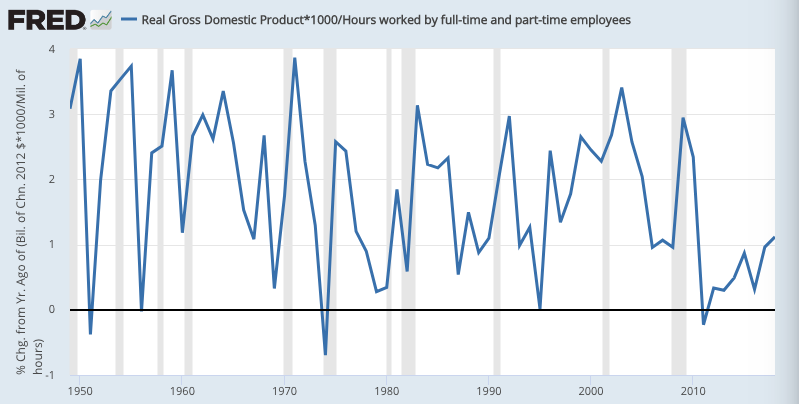
Economists have been concerned of late because productivity growth has been moribund in the past decade or so (and sluggish since the 70s compared to previous decades). Here’s annual percent growth in productivity.
But the measure of production here poses a conundrum: production minus consumption — our “saving” — doesn’t explain all the increase in our collective wealth. It’s off by about 30 trillion dollars. See below.
So suppose we instead assume that increasing wealth is itself a (superior?) measure of how much stuff we’ve produced and not consumed. We can easily create a different measure of production: stuff we’ve produced and not consumed, plus stuff we’ve produced and consumed. Equals, stuff we’ve produced. (Not coincidentally, this is also the definition of Haig-Simons income — ∆NW + consumption.*)
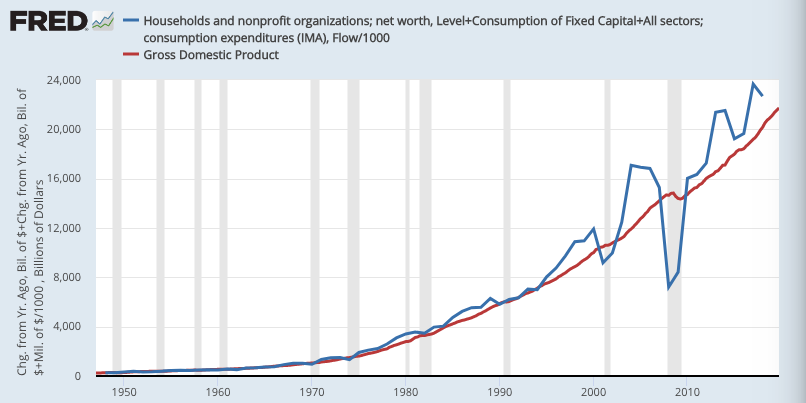
Net worth in this figure is annual change. Here’s the cumulative sum of those series.
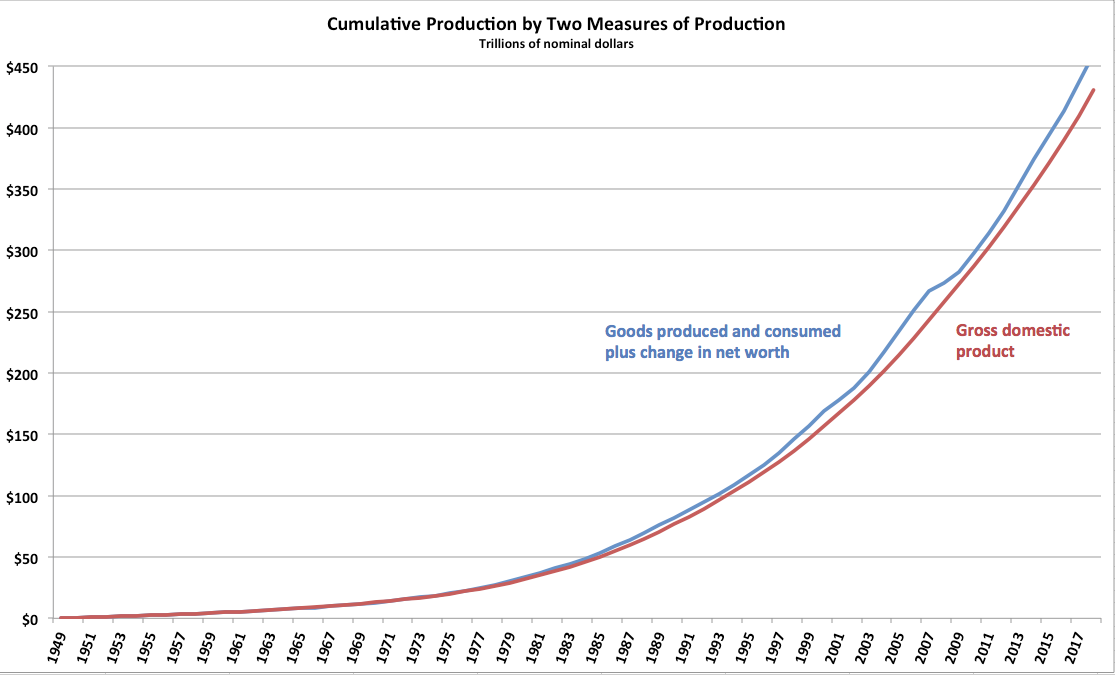
The difference may not look like much (it’s dominated by production of consumption goods, which have been…consumed), but it represents $30 trillion in additional accumulated wealth, net worth. For reference, households’ total net worth end of Q3 2019 was $114 trillion. (No: adjusting these two series for inflation-adjusted dollars barely changes this comparison — just the numbers and scale on the left axis.)
What we have here are two very different measures of production and accumulation, both based on market prices/purchases — one on prices paid for new goods and services over the years, the other on existing-asset markets’ price-estimates of what all our “saved” stuff is worth.
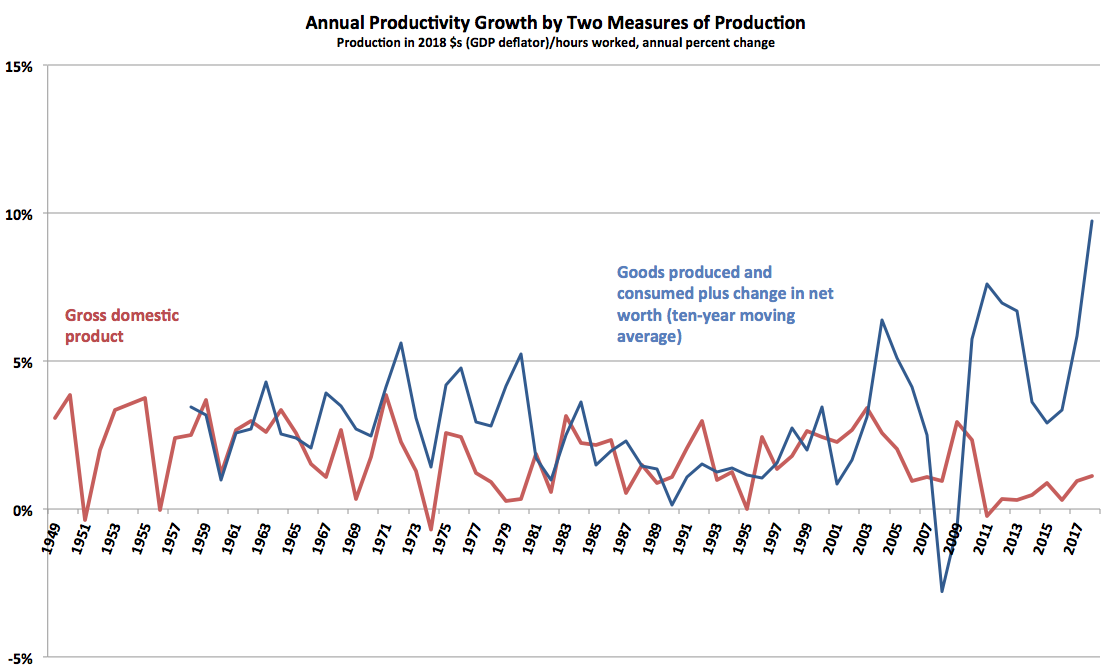
Here’s what “real,” inflation-adjusted productivity growth looks like using those two different measures of production. (The consumption + ∆NW measure is subject to big swings and volatility based on wealthholders’ “animal spirits,” so it’s smoothed here to give the long view, with a ten-year rolling average.) Source data here.
Which of these market-price-based measures of production is “correct”?
If you think production minus consumption should equal “saving,” which should equal change in wealth/assets/net worth, you have to reject the GDP-based measure, based on purchase-prices in the markets for new goods. It doesn’t explain wealth changes. But that suggests markets have been underpricing new long-lived goods for years — at least according to later years’ asset markets.
But the net-worth based measure is pretty eye-popping and hard to swallow based on previous understandings. (Perhaps: it could be revealing the unpriced value of free internet services, this article for instance?) It’s tempting to reject it.
To be clear: doing so is to say that the new-goods markets/prices were right about what the purchased stuff was worth (and ditto, national accountants’ tallies of all those market purchases, tallies which include large and necessary but sometimes convoluted estimations like imputed rent and profits for owner-occupied housing). And, it’s saying that the asset markets are wrong, have been since the 90s. It’s saying we’re in the mother of all multi-decadal asset bubbles.
The net-worth approach to measuring production is attractive because production minus consumption equals change in wealth — an intuition that fails with the standard measure. And that net worth approach suggests that current productivity growth is very healthy indeed.
I’ll leave it to my gentle readers to consider the implications.
* For those who are fans of Godley and Lavoie’s work, check out their discussions of Haig-Simons income vis-a-vis net worth in the index for Monetary Economics, notably page 140, and importantly the top of page 490, in their appendix on sectoral balances (though they don’t call them by that name).