The markets have been showing a rather particular schizophrenia over the last dozen or so years — but not, perhaps, the one you may be thinking of. This schizo-disconnect is between the goods markets and the asset markets, and their valuations of U.S. production.
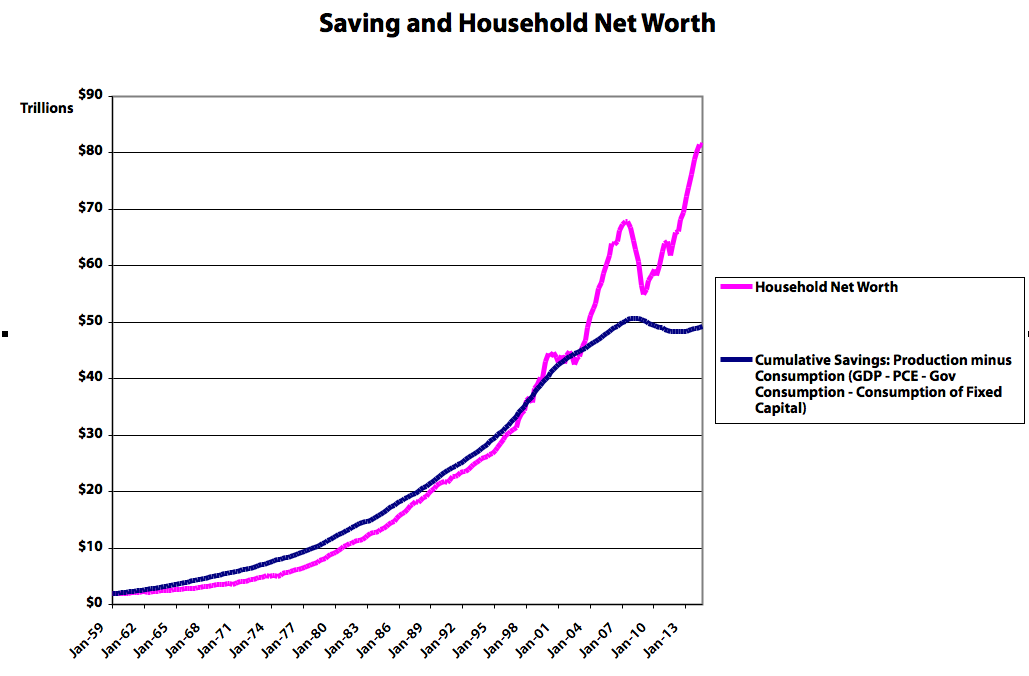
In short, the existing-asset markets think we’re producing and saving far more than we see being sold and accumulated in the newly-produced-goods markets. Take a look:
(See here for some ways to think about these measures. The spreadsheet cumulating saving is here. You can find all the data series on Fred here.)
A huge gap has emerged between what we’ve saved and what we’re worth.
Household Net Worth is the asset markets’ best estimate of what all our privately-held real assets are worth. It’s our best or perhaps only proxy for that value. (Household net worth includes all firms’ net worth, since households are firms’ ultimate shareholders. Firms, by contrast, don’t own households. Yet.) This is not just about assets like drill presses and buildings, but also skills, techniques, knowledge, organizational systems, etc. — all the tangible and intangible stuff that allows us to produce more stuff in the future. Household Net Worth at least provides us with an index of the change in that total value, as estimated by the asset markets.
As we increase our stock of real assets (“save,” by producing more than we consume), household net worth (wealth, or claims on those real assets) increases. The valuation jumps up and down as asset markets re-evaluate what all those real assets are worth — how much output and income they’ll produce in the future — but the two measures generally (should) move together.
Except: Since about ’98, and especially since ’02, that hasn’t been true. And no: zooming in on earlier periods doesn’t reveal the kind of anomaly we’ve seen since 2002.
There are two oddities here:
First, the flattening of cumulative savings: this measure was increasing exponentially for decades. Then it slowed significantly starting in the late 90s, and has gone flat to negative since The Great Whatever.
Second, the continued exponential growth of household net worth, and the resulting divergence of the two measures.
But bottom line: Net Worth and the cumulative stock of savings used to move pretty much together. They don’t anymore. What in the heck is going on?
There are three possibilities:
The asset markets are wrong. They’re wildly overestimating the value of our existing stock of real assets, and the output/income they’ll deliver in the future. See: “Irrational exuberance.”
The goods markets are wrong. The market for newly-produced goods and services is setting the prices for newly produced goods below the production’s actual value.
GDP is wrong. We’re producing something that’s not being measured by the BEA methods (tallying up what people spend on produced goods). There’s production the GDP methods can’t see in sales, so it doesn’t show up in saving (production minus consumption). But the asset markets can see it (or…sense it), and they deliver it to households in later periods, through the mechanism of market asset revaluation/capital gains.
Techno-optimists will like this last one. You’ve heard it before: The BEA has no sales-based method for estimating the produced value of free digital goods like Wikipedia, or the utility people derive from using them. They’re not purchased, so the BEA can’t “see” them. They could look at ad dollars spent on Facebook as a proxy for the value of browsing Facebook, but…that’s a pretty shaky estimation method, especially when many of those ad dollars would have been spent anyway, in other media. GDP simply doesn’t, can’t, measure that value, because nobody purchases it.
The timing sure supports this invisible-digital-goods story. The divergence takes off four to eight years after the release of the first mainstream web browser, and the global mainstreaming of the internet in general.
But it’s worth pausing before swallowing that explanation wholesale. You have to ask, for instance:
How does the internet/digital-goods story explain the flatlining of cumulative savings? Shouldn’t that continue to rise, though perhaps not as fast as net worth? Has the internet killed off sales (and accumulation) of traditionally measurable, purchased, goods to the extraordinary extent we see over the last dozen-plus years?
Are the asset markets seeing something else that GDP can’t see? Improved supply-chain management? More-efficient corporate extraction of profits from other other (less-developed?) countries? More-effective suppression of low-end wages? The rising costs of education and health care? (Which the BEA counts as consumption, extracted from saving, even though they’re arguably investment at least in part; they produce very real though intangible and difficult-to-measure long-term value/assets.) Or — here’s a flier — does it have something to do with the Commodities Futures Modernization Act and other financial “liberalizations” passed in the waning days of the Clinton administration? Something else entirely? In particular: would any of these explain the striking trend change in the cumulative savings measure?
Whatever the causes, the divergence of these two measures suggests a rather profound and singular economic shift of late — a shift that is not being widely discussed, even amidst the recent spate of commentary on Piketty’s Capital. (Piketty, by the way, defines wealth and capital synonymously — though his usages are not always consistent.) Prominent exceptions include the economists Joseph Stiglitz and Branko Milanovic, who are actively interrogating the troublesome theoretical intersection of wealth and real capital. The recent divergence of these two national accounting measures suggests that they’re tilling fertile ground for our understanding of how monetary economies work, and how we measure those workings.
Note: Technically one might add (negative) government net worth to the household measure to arrive at national net worth. But: 1. government net-worth estimates are inevitably dicey to meaningless. Government assets (and services) aren’t generally sold in the marketplace, so we have no observable sales information to base our estimates on. Liabilities are also very tricky: estimates vary massively based on your chosen time horizon and (necessarily) arbitrarily chosen discount and economic-growth rates. And 2. It barely changes the picture drawn above. Feel free to add government to the spreadsheet if you want; you’ll find estimates of net worth for the federal, and state/local, government sectors here. Net worth is — as it should be — the bottom line for each sector.
Cross-posted at Angry Bear.
Comments
31 responses to “Is GDP Wildly Underestimating GDP?”
Could a low real interest rate explain it? For a given set of cash flows that changes the valuation. And we know yields have fallen significantly.
@Effem
That might make sense. That yield decline started to get legs in the late 90s/early 00s.
http://www.advisorperspectives.com/newsletters11/images/35-6-fig1.gif
But that decline also suggests (?) that the market was expecting slower growth in the future. Seems odd to find that expressed in higher asset valuations.
Just because asset prices are higher, how can you conclude that they are “wrong?” Maybe they have changed for good reasons? Or maybe they were “wrong” in the past (see “equity premium puzzle.”)
Some reasons they might have changed: slower population growth, more inequality (bidding up value of some scarce assets like urban real estate, NBA teams, etc.)
@3rdMoment
All true. But I didn’t say asset prices were wrong. I said that was one possibility.
Still:
Why the sudden flatlining of cumuluative savings?
Why the sudden simultaneous divergence of these two measures?
There’s another factor overwhelmingly ignored by economists, and that’s fraud. Asset values are wildly inflated despite glaring lack of demand, completely contrary to any theory of anything. Fraud is now the the only way to “make money” in massively rigged markets. During the mortgage crisis, honest appraisers were blackballed en masse, literally. How can asset prices be believed? It’s the quality of the data, masked by the biggest white-collar crime wave in history. Criminals are funneling all those savings into the black hole of money-laundering, offshore accounts, drug cartels and other invisible “deals.” Shadow banking is off the charts again–much of what they “invest” in is unreported. Pension funds are being looted–savings are simply vanishing into usurious fees and shady “investments.” It’s not really a mystery if you start looking at the crime side. Economics needs to adjust the theories to account for the fact that inequality and crime tosses the rules out the window.
@zapster:
I’m with you, but even if you describe every instance of rent-taking as fraud, it’s hard to imagine so much emerging so fast. $30 trillion over a decade?
Your comparison of household wealth and saving is not valid in my opinion. It is incongruent from a sectoral analysis perspective.
You should be comparing household wealth to the combined saving of households and domestic business – not household wealth to what appears to be some sort of construction of national saving. In other words, you should be subtracting the government deficit from a correct measure of national saving and comparing that series to household wealth.
The reason is that government deficits increase household wealth but have no effect on measures of national saving – other things equal in both cases. For example, if the government today sends out a surprise tax refund check of $ 100 billion to the household sector, household wealth instantaneously increases by $ 100 billion. Household saving increases by the same, but government saving decreases by the same. So national saving doesn’t change.
Similarly, if the government today sends out a surprise tax refund check of $ 100 billion to the corporate sector, the book value of corporate equity instantaneously increases by $ 100 billion. That will be reflected as an increase in household wealth as well, due to stock market valuation of book equity, apart from any additional market valuation changes. And in this case, corporate saving increases by the same amount, but government saving decreases by that amount. So national saving doesn’t change.
Turning to the data, cumulative net household saving just for the 3 years 2010 to 2012 exceeded net national saving by $ 2.1 trillion! And since business saving is embedded in household wealth through stock market valuation (of retained earnings), that has to be added in as well. In fact, for just those same 3 years again, the combination of cumulative net household saving and cumulative net domestic business saving exceeded net national saving by $ 4.2 trillion! That’s a direct flow contribution to the deviation in your comparison. That is the number that has to be compared to the increase in household wealth over the same period. And that is without any further valuation changes due to rising house prices and a rising stock market!
(Data from Z1 F8)
Those are the numbers with the correct definitions for saving and for wealth.
I won’t comment further, particularly on the apparent correlation in the left hand part of your graph. It’s your data and you can figure it out. It may have something to do with the effect of the outsized twin deficits over the past 15 years and compound growth. Most of the cumulative deficits for both government and the external sector have obviously been incurred in nominal dollars over that recent time period. Anticipating a “you haven’t convinced me†type rejoinder (if any), I’ll just say that I’m in the facts and (accounting) logic business as the prerequisite to everything else – not the convincing business. That shuts down about 95 per cent of what I see written in the blogosphere in general, and so I go no further. So goes the “discipline†of macroeconomics, where the majority of arguments we see in general are effectively derailed in ignorance of the accounting foundations on which the meaning of certain key words and terms liberally used depend.
@JKH: Running out the door but just want to ask one thing while I’m thinking about your reply:
“Saving” is what we produce minus what we consume, right?
GDP is total production, and I think I summed all the consumption measures, right?
SR,
You have to be careful.
Govt net worth is defined in SNA.
If you are using national saving, you also have to use national net worth for correct comparison.
“Technically one might add (negative) government net worth to the household measure to arrive at national net worth”
National net worth is the sum of net worth of not just households and the government, but also resident producers and the financial sector.
@Ramanan
But households are ultimate shareholders of firms, right? (The reverse is not the case.) So firm NW is reflecting in HH NW.
HHs don’t issue equity, and firms don’t hold equity claims against households.
Adding (negative) govt net worth, BTW, barely changes the picture (fed+state&local NW from the IMAs):
http://www.asymptosis.com/wp-content/uploads/2015/01/Screen-shot-2015-01-24-at-11.31.25-AM.png
@JKH:
Red line is cumulative total economy Net Saving from the IMAs.
It’s different–in particular the divergence starts much earlier–but the general picture, and the anomaly, remain the same.
Any notions on why this is happening?
Steve,
In my opinion, your graph and the premise for your question are wrong – because of deep sectoral inconsistencies in the comparison between the two lines.
I’ve already explained why.
Your definition/concept of saving is also incorrect. The correct one goes back to Keynes. The economics profession has generally adopted Keynes’ idea correctly, across different schools, defined correctly in most textbooks. I don’t need to repeat it here – particularly if you haven’t acknowledged it after all this time. Ramanan in particular and I have noted the correct concept so many times that it doesn’t need to be repeated again.
But I will say that the idea of “saving†is only due to the requirement for such a concept in an analytical world of sector decomposition, in which saving and investment start to get separated from each other by sector. And as a starting concept, “saving†has to be applied consistently and coherently to the sector space being considered. National income and wealth accounting has been developed over decades to respond to that requirement. It is replete with sectoral decomposition and breakdowns of saving by sector, in accordance with the primary definition. And it is stock-flow consistent across sectors.
The Z1 table I referenced is consistent with the correct definition/concept at the sectoral level. Supporting drill down tables are scattered throughout Z1.
That’s all I’m going to explain from my perspective. You seem to have been on a crusade to reconstruct a “Steve Roth world†of these things, bottom-up. Best of luck with that, but I really don’t have the time to responding to requests to examine your reverse engineering work in detail. I’ve said before that I’m fully satisfied with complementary analyses that are already available for national income, wealth, flow of funds, SNA, and “Haig-Simons†marked to market adjustments. This stuff has been developed over decades. It’s all good. Theirs is no need for a wheel-reinventing reverse engineering of all of that from the ground up. I’m offering a top down observation on how your particular construction in this case doesn’t work according to my assessment. You’re free to consider it, or ignore it.
(I’m generally inclined to respond not very enthusiastically to “just running out the doorâ€, “check my workâ€, “you haven’t convinced me†engagement styles. I’ve stated where I think you’re wrong from a sectoral accounting perspective. Maybe I should turn the tables and ask you for exactly what is wrong with my explanation, which also uses the actual saving data from national income accounting. Check my work – and maybe along with it all the national income and wealth accounting development back to Keynes that is consistent with it.)
Cheers.
P.S.
“Steve Roth World†= SRW
Oh no! Not another one!
Regarding your modification to the saving calculation, it’s a nice addition in term of data sources, but it makes no difference to the fundamental problem in your comparison. I explained what you might want to consider in my first comment. It’s an incongruent comparison from a sector composition perspective. My first comment definitely considered that net saving data, along with the rest that’s required for consistent analysis.
rats
I thought I had dropped the last paragraph from that second last comment
@Asymptosis
No it is not Steve.
If I do it your way … for a closed economy … national net worth doesn’t add to the value of non-financial assets … but in the SNA it does.
And as JKH said, “… deep sectoral inconsistencies in the comparison between the two lines.”
Quite accurate.
And Steve,
About Haig-Simons and Godley-Lavoie … even though G&L mention it, their paras can be rewritten with no mention of Haig-Simons at all.
The reason they get into such discussions is that they need to consider real holding gains and losses and define real income by including real holding gains and losses: it has less to do with Haig-Simons actually.
@JKH
I’m really not trying to be pissy here. I’m trying to understand the accounting and economic relationship between cumulative savings (note the plural) and net worth/wealth. (And ultimately, the relationship of monetary wealth to real capital.)
“combined saving of households and domestic business…In other words, you should be subtracting the government deficit from a correct measure of national saving”
So:
HH&Firm Net Saving – Gov Deficit = Total Economy Net Saving
I’ve added that first measure here (HHs, Nonf, & Fin biz Net Saving from IMAs lines 9-11):
IMA Firms&HH cumulative net saving – IMA Total Economy cumulative net saving =$57 trillion = Gov cumulative net dissaving. ($50 trillion of that is fed negative cumulative net saving, the rest is S&L.)
But Fed debt held by the public is only ca. $13 trillion. Is that not the cumulative “deficit” in your construction above?
Can you help me understand what that $57 trillion difference is? How it relates to gov debt?
Wild guess: Does it have to do with SS/Medicare liabilities (and their somewhat vexed relationship to measures of household cumulative savings and/or net worth)?
Or is there a cumulative rest-of-world figure that I’m ignoring that would explain this?
And:
I’m still really curious: isn’t saving ultimately what we produce minus what we consume? I think of that as KW (Kuznets World), not SRW…
Thx.
@JKH
Not to worry.
This also might help me. If I was to ask you:
What is America’s Net Worth?
and:
How much has America saved?
What measures would you point to go give me an answer?
And how would you explain the relationship between two?
Any suggested relationship between me and SRW, BTW, is among the highest compliments I can think of. 😉 (And among the most misplaced.)
This is very rough and quick and dirty:
You want the following equation to hold on a cumulative basis:
I = S
Where S is the sum of domestic and foreign sources of saving for US Investment
I.e. S is the sum of domestic saving and the capital account surplus
That works on a gross and net basis
So you can take net measures of Investment and net measures of domestic saving since the capital consumption adjustment takes place entirely inside the US on both the investment and the income side.
What you want to end up with on a net basis is something that relates intuitively to the US balance sheet as represented in the flow of funds reports.
B 100 is the key balance sheet reference
What you see there is nonfinancial assets of $ 28 trillion (latest)
And net worth of $ 81 trillion
That means that net financial assets have contributed $ 53 trillion to net worth – because all liabilities are financial. A lot of those financial assets flow through to real investment backing at cumulative book value – e.g. a factory that is financed by debt and equity.
So that’s $ 81 trillion in net worth that in some sense is backed by:
Cumulative net investment in real domestic assets
The cumulative budget deficit
Less the cumulative capital account surplus (which is the external source of cumulative saving and wealth in the US, alongside household wealth (which incorporates business wealth via the financial sector))
But all of that cumulative flow stuff is marked to market essentially – to get to $ 81 trillion.
So the book values – which are the cumulative net book values – are going to be smaller than the wealth, intuitively:
It’s going to be smaller not only for stocks but very substantially for cumulative housing investment, due to market appreciation in both
So you’re going to get big valuation pops from cumulative net saving in both of these areas
Tobin’s Q for stocks
And God knows what for real estate
And same comparison must be done for the cumulative capital account surplus
Where it gets quite interesting
Because the cumulative capital account surplus is less than the net balance sheet wealth of the rest of the world in the US; in other words, the cumulative capital account surplus is less than the net international investment position, which is a net liability of the US to the rest of the world. This has happened because the US generally makes more productive financial asset acquisitions from the rest of the world than vice versa – so the net liability is less than the cumulative capital account surplus (current account deficit). Anyway, there’s a net financial claim of the rest of the world on the US which is less than what it otherwise might be because of effective US investment strategy in the rest of the world. Net US valuation gains reduce the cumulative book value flow. That makes the US wealthier, other things equal.
So all of this stuff has to be taken into account in assessing how household wealth compares to cumulative household and business saving – but not directly to national saving.
And yes, government bonds held by some internal accounts should probably be subtracted from gross outstanding bonds. Don’t subtract those held by the Fed though, because they flow through to the public via Fed liabilities.
That’s probably enough to chew on for now.
Sorry, I’m no good with extracting or confirming time series data. I just know the answer is there somewhere once the accounting pieces are put together.
Again, this was rough, at the conceptual level.
I suspect we went over a lot of this a few years ago.
Again rough:
On the definition, its really done from the income side – using appropriate interpretations at the sector level.
So households don’t produce investment goods – but they save.
So saving is defined there as income not consumed.
The thing totally rests on the recognition of the role of financial intermediation in a monetary economy.
So the logic of how the thing needs to be defined defaults to that requirement for consistency and usefulness at the sector level – with consistency of aggregation.
So it must be defined on the income side in order to do useful sector analysis.
If there are no sectors (imagine that), then I = S and you have your saving equal to production minus consumption.
But that’s as useless as trying to use I = S for every single sector in a complex, sectoral economy.
And S for business is retained earnings for the accounting period.
And S for government is basically the budget position – deficit or surplus.
And S for the foreign sector is the capital account surplus – since that represents the net saving flow that comes in to fund part of domestic I.
Of course, there are all sorts of complications you can introduce from there, including how the government accounts for capital expenditures and such things, but there are a billion of those.
The core logic is more important than those complications. Without it, we are lost.
Forgot to remind you that the $ 81 trillion plus the value of the net foreign investment position of the rest of the world in the US – that number includes the cumulative budget deficit as a net financial asset component (adjusted as appropriate). The restates my very first point. It’s part of net saving by those two sectors. Think of it as that somebody has to buy the bonds and fund the deficit – and those are financial assets for those people that are reflected in their net saving.
This is exhausting.
Glad I don’t do it very often.
🙂
Also keep in mind that the stock market has had a massive rise since 2008.
And budget deficits have been substantial.
The first is a big contributor to the increase in household wealth.
And the second is a big factor in understating net household saving – if you make the mistake of using a national saving calculation instead.
These are major quantities when compared to the cumulative history before that.
SR,
If you want to compare two things you that you intend to, you should compare:
1. Total Investment of resident sectors + CAB
2. Total nonfinancial assets of resident sectors + Net International Investment Position.
(Cumulative in the first)
Not sure what it achieves but that’s comparing right things …
@JKH
I’m extraordinarily pleased to say that I followed pretty much all of that accounting arithmetic on first reading. I can largely thank you and Ramanan (and SRW) for that (along with a great deal of mucking about in the accounts…)
@Ramanan: “you should compare…Not sure what it achieves”
I will pull those numbers and graph them. But I think this encapsulates where we talk past each other a lot.
What I’m trying to achieve is an understanding of how economies (our economy) works/is working. If a given measure or (compared) measures don’t “achieve” that, why “should” I use those measures or that comparison?
So I’m asking exactly that question: what would that comparison achieve? What would it tell us? (I’m not questioning its validity; I’m asking what it means.)
Right now I’m trying to think about what America’s saved and what America is worth. (Because the two figures seem to have diverged anomalously of late, and the total economy cumulative net savings measure has gone disconcertingly flat to negative. Weird. What does that mean?)
It would really help me if you would give me a number for what we’ve saved and what we’re worth, pointing to particular accounting measures. With, optionally, a sentence or two (no more!) explaining why these are economically significant measures/comparisons.
I totally understand if you want to qualify those, or give ranges based on more than one measure, because things can be usefully looked at in different ways. But again, with brief explanations of why.
Or feel free to tell me that I’m on a fool’s errand, that it makes no sense to seek those particular measures and comparisons. That there’s no valid economic insight to be had there.
Now I’ll go pull Ramanan’s measures…
@Asymptosis
SR,
About talking past each other: I keep close to concepts in national accounts.
About your question:
An economy is more than the sum of its parts. It is not just individuals but also institutions.
So when you ask “how much did America save” and “how much is American worth” it means what I mentioned in my last comment. National saving which is total investment of all sectors plus the CAB. So national saving is not household saving. National net worth is difficult to find. I am not sure if a proper official statistic exists. This is because the government’s nonfinancial assets is difficult to measure – as you yourself say. But the absence of the number shouldn’t make you change the concept altogether.
Compared to most of the responses, mine might seems a little amateurish, but here goes.
The point of this blog (it seems to me) was not to define comprehensively savings, investment or total wealth, but to explore the idea that the well established relationship between them has ended.
If this is indeed the case, I would think the first option is the most likely. Asset values (especially land/housing) are still massively over-inflated in many economies, mainly as a result of all the ‘funny money’ that has been fraudulently created and laundered since the late 1990s.
Could this explain both diverging trends. Saving is down because of cheap and easy access to all this worthless cash, while asset values/wealth is over-priced because much of this money has found it’s way into stocks, shares, commodities, land, housing etc.
Either way, our economies are certainly behaving in a deeply dysfunctional way and are almost permanently imbalanced.
@Asymptosis
Is it? Seems more plausible than the ‘miracle’ economy we have where we constantly spend more than we earn, and get richer at the same time…
@Martin
Just curious Martin, what is “unfunny” or “serious” money? And how was the money fraudulently created? I think we can have explanations that don’t involve this hyperbole.