I received some very interesting comments from Yaneer Bar-Yam to my recent Evonomics post — “Capital’s Share of Income is Far Higher than You Think.” He pointed me to his very interesting paper, “Preliminary steps toward a universal economic dynamics for monetary and fiscal policy.”
I’m using this space to reply with with some stuff that can’t display in that comments space.
I haven’t gotten to the full-boat, multipart reply that I have floating in my head, but wanted to get back on two items for the nonce, a question plus a response on recession prediction:
1. What is the function in this model that “causes” capital gains? This always strikes me as the core problem in a complete SFC model where flows (including holding gain “flows”) balance to and fully explain (change in) net worth: if you can write a reaction function that predicts asset-price changes, you’re a very rich person… 😉
2. The recession-prediction based on investment/consumption ratio misses a bunch of recessions (false negatives). Contrasted here with a personal favorite: every recession since 1970 has been preceded by a year-over-year decline in real household total assets/net worth. (Including liabilities to arrive at net worth instead of just using assets adds no predictive value). Click for FRED.
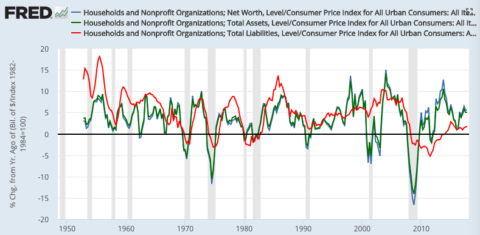
This predictor is seven for seven. Though: there are two recent false positives — shortly following the 2001 and 2008 recessions.
The investment:consumption ratio bruited as a predictor/cause in the paper is four for seven, and even there: the first year of decline in this ratio seems late in each case (as opposed to the measure’s peak) to suggest it as a cause:
| Investment:Consumption ratio peak/first year of decline | Year-over-year declines in real household net worth (CPI-adjusted; base year 82–84) | Quarters of real YOY net worth decline – YOY % decline in first declining quarter – NW decline peak-to-trough % | Beginning of NBER-dated recession |
| Q4 1969 – Q4 1970 | 4 – 3.9 – 5.6 | Q1 1970 | |
| Q4 1973 – Q1 1975 | 6 – 3.8 – 9.9 | Q1 1974 | |
| Q1 1980 – Q2 1980 | 2 – 1.5 – 1.4 | Q1 1980 | |
| 1981/1982 | Q3 1981 – Q2 1982 | 4 – 1.8 – 1.0 | Q3 1981 |
| 1989/1990 | Q3 1990 – Q2 1991 | 4 – 3.2 – 1.9 | Q3 1990 |
| 2000/2001 | Q4 2000 – Q4 2001 | 5 – 2.0 – 8.1 | Q1 2001 |
| Q2 2002 – Q1 2003 | 4 – 1.8 – 5.2 | ||
| 2007/2008 | Q4 2007 – Q3 2009 | 8 – 3.8 – 19.3 | Q1 2008 |
| Q3 2011 – Q4 2011 | 2 – 0.5 – 2.6 |
I have various ideas and explanations for all this, but apologies, haven’t found time to write them all up.
Comments
4 responses to “What Causes Recessions? A Physicists’ Complex Systems Model”
If you use the Personal Consumption Expenditure Chain-Type Price Index instead of the CPI you get some different results. Of the eight recessions since 1979 five are “predicted” and three missed with three “false positives.” Maybe your explanations should include why a change in the price index results in such different results.
Isn’t net worth going to be dominated by ‘value of real estate’? Id think that this would dominate the median household net worth.
@Michael Sankowski
If you toss “median” in there, I suppose you could say that. Cause non-housing wealth is so concentrated in the up 10 or 20%. But here’s the household total balance sheet. RE is about 25% of assets.
https://www.zerohedge.com/sites/default/files/inline-images/q1%202018%20assets%20liabs%20breakdown_0.jpg?itok=Ry829PY0
“if you can write a reaction function that predicts asset-price changes, you’re a very rich person…”
I bet you quants are using linear algebra optimization techniques to solve Ax=b where A is a matrix representing all possible future market states, b is a vector of your desired payouts, and x is your optimal portfolio. You can hedge perfectly and profit no matter what. The only risk is how much you will make, not whether you will profit.
Derivatives strip out risk and represent net financial asset creation. So you can hedge against a recession or crash. Goldman Sachs bought insurance (Collateral Debt Obligations, etc.) on its Mortgage-Backed Securities; GS was prepared to profit if there was a crash in MBS, or if there wasn’t. The insurance piece (AIG was guaranteeing MBS with MBS) failed in 2008; but the Fed stepped in to make sure GS got paid on its insurance claims when MBS went to $0 in financial markets.
Supposedly the insurance piece is fixed and derivative net financial asset creation is paying out dividends as capital gains (or unreported income) to investors so they can afford inflating housing prices, as investments …