The following paper was a real Aha! for me. It lays out in very clear language the understanding of economies that I think is embodied in Modern Monetary Theory or Chartalism. (Though I’m not a well-versed theorist; I could have that wrong.)
It also very convincingly explains the ultimate (as opposed to proximate) cause of our recent…economic difficulties.
Banks As Social Accountants: Credit and Crisis Through an Accounting Lens – Munich RePEc Personal Archive. –Dirk J. Bezemer, Groningen University
Here’s what I got out of it:
Money is credit, and is created by issuing credit. The earliest forms of money we know of are tally sticks of credits — IOUs — that eventually started being passed around as currency. Money is created (“printed”) by somebody issuing credit — a merchant, temple, lord, government, or in our modern world, probably a bank.
Think of a dollar bill as the same as a stored-value card issued by Target. Same for any “dollar” that you have in your bank account. It has value because somebody (everybody) is willing to give you credit for it — take it in exchange for something else.
Its ultimate value, though, is because you can use it to appease the ultimate issuer: you can pay your taxes — and hence keep your sorry carcass out of jail. (De jure, at least, the only debtor’s prison is tax prison.) It derives proximate value from a million other sources, of course — your desire to visit Hawaii, for instance.
Most money is “printed” by banks, not governments — though the authority to do so, and the limits on that authority — come from government. Banks (and their shadow counterparts) print/create at least ten times as much money as governments, via fractional-reserve lending. (The investment banks a few years back were leveraged 50-to-1.)
When a bank gives you a loan — issues you credit — they are quite literally creating (metaphorically “printing”) new money and putting it in your bank account. All they get in return is promises. (You may fulfill those promises by earning, or by getting credit from someone else — quite literally passing the buck.)
Banks decide who gets that newly-created credit/money, based on who they think is creditworthy.
And who, of late, have they considered to be creditworthy, hence worthy of receiving the money?
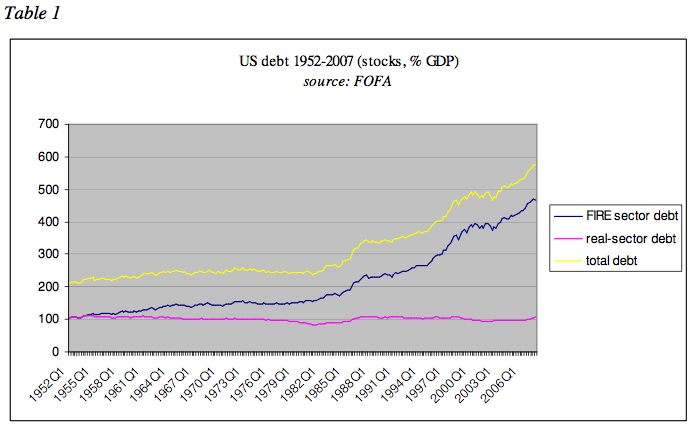
Here’s Bezemer’s revelatory picture — hiding some very careful and diligent accounting* behind a deceptively simple graphic. (“FIRE” is finance, insurance, and real estate.)
As Bezemer describes it:
an expansion of the financial sector from being equal to the size of the real economy in 1952 to a volume of nearly five times GDP in 2007.
Like a good accountant, he not only shows us the stocks, but the flows:
It’s no surprise that all that newly-printed money in the financial industry 1) drives up prices of existing assets, and 2) prompts the creation of new financial assets that can be sold to get a share of that money.
My gentle readers will no doubt remember that credit issued to buy inflated securities — causing them to inflate further before de-inflating — is what precipitated The Great Depression. (At least the main proximate cause.)
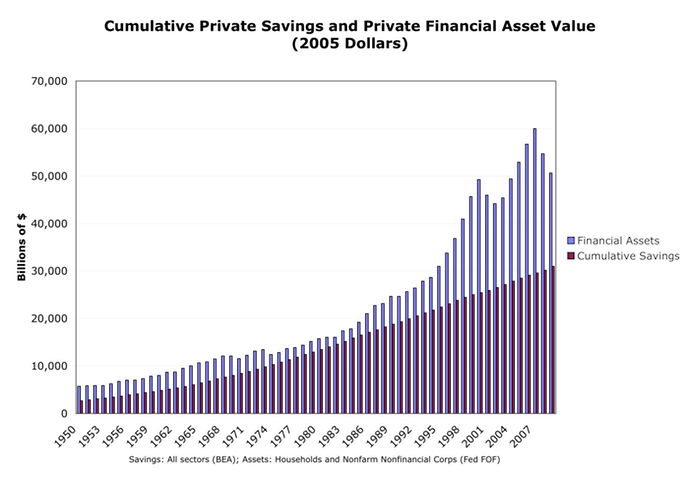
The traditional source of funds to purchase financial assets — personal and business savings from income and profits — don’t even begin to account for the runup since the ’80s (my graphic, not Bezemer’s):

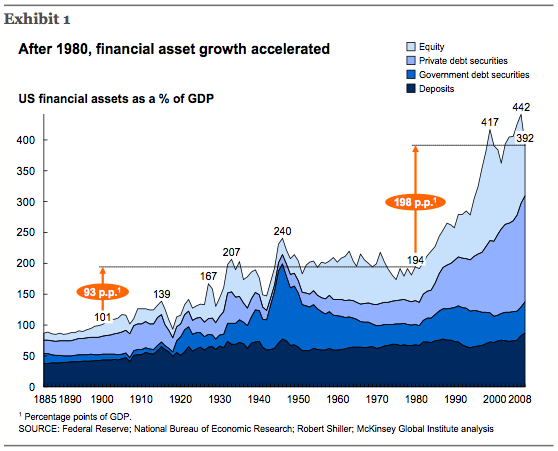
Here’s another picture of the growth in financial “investments” (different accounting methods, similar picture):
(McKinsey and Co. PDF. Page 8.)
I’m going to give the final word here to Bezemer. Please read these paragraphs twice; they’re cogent, lucid, and clear. (I’ve broken his paragraph into three, included a bracketed comment that may be helpful to some, and highlighted what I think is a crucial conclusion.)
From the above it is clear that the growth of debt depends on the use of newly created credit-money – whether in support of self-amortizing tangible investment [houses and factories, equipment and software, which both throw off real value/income and decay and become obsolete over time], or in debt-bearing financial market investment.
This may not be so obvious on the microeconomic level since in an asset price boom any single individual can borrow, purchase assets, and sell them to pay off the debt with a profit left. No personal debt remains, and the good news spreads. However, as in many areas of economics there is a micro-macro paradox, or a ‘fallacy of composition’. For on the macro, society-wide level, there must be a growth in indebtedness of the economy when assets are traded at rising prices.
This indebtedness takes the form of both rising commitments for the real sector to finance asset transaction out of wages and profit, and rising actual debt levels. When the asset was sold at a profit, someone else bought the asset at the new, higher price. He or she financed this either by diverting liquidity away from real-sector transactions, or by borrowing – at higher levels than did the first buyer. Therefore asset price booms are accompanied by rising debt and by a slowdown in real-sector nominal growth.
——————————
* In mapping debt growth onto economic growth (in GDP), we note that the FOFA [Fed flow-of-funds accounts] total-debt definition is both too wide (it includes FIRE sector debt) and too narrow (it excludes trade credit). Therefore in order to arrive at credit to the real sector (i.e. in support of GDP), we subtract from the total value of credit market instruments all equity, mortgage and finance credit market instruments which support FIRE sector transactions, not transactions in goods and services. We also correct for inter-firm trade credit (account FL383170005 in table Z.1), which is debt creation in support of transactions in goods and services, but not via credit market instruments and therefore not recorded in the FOFA definition of total debt. Trade credit is substantial: the stock of outstanding trade debt equals a quarter of GDP (24.4 % in 2007Q4), up from 12 % at the start of the series we study in 1952Q1. This is just one illustration of the importance of studying the whole credit supply, not just an (arbitrary) statistical definition of ‘money’.


Comments
14 responses to “Who “Prints” Money? And Who Gets to Have It? It’s Up to The Banks”
Wow, nice graphs. I think I’m pretty good at this stuff but this is going to take awhile to digest—I’ll get back to you in a month. (haha)
There’s more here than I can attempt to digest in my current sleep-deprived and semi-coherent state. But your graphs are a dramatic validation for this comment I made Modeled Behavior this afternoon.
http://modeledbehavior.com/2011/01/30/the-great-stagnation-a-first-cut/#comment-10111
(Brian commented ahead of me.) Rick Russell’s libertarian talking points are “interesting” as well. I see now that Karl has a series of posts on Cowan’s book.
More homework in the days ahead.
And check this out.
http://jazzbumpa.blogspot.com/2011/01/what-made-50s-through-70s-so-special.html
Cheers!
JzB
Cheers!
JzB
This approach largely makes sense to me. While for the last two years we’ve heard lots of people loudly worrying about hyper-inflation, no one seemed to talk about inflation during the build-up of the housing bubble. But what else was it than lots of credit fueling a rise in debt and prices (at least in the housing sector)?
Now banks are de-leveraging, much less credit is being extended, and we’re in a slow-down. Not exactly the conditions for a hyper-inflation!
What we’re experiencing right now on the monetary side of the equation is what I coined the term as ” a velocity of money trap.”
This indebtedness takes the form of both rising commitments for the real sector to finance asset transaction out of wages and profit, and rising actual debt levels. When the asset was sold at a profit, someone else bought the asset at the new, higher price. He or she financed this either by diverting liquidity away from real-sector transactions, or by borrowing – at higher levels than did the first buyer. Therefore asset price booms are accompanied by rising debt and by a slowdown in real-sector nominal growth.
Isn’t this an explicit validation of what I said at MB:
. . . or is it that financial tail-chasing is a gargantuan and grotesque misallocation of resources? I read somewhere a while back that the total market value of financial derivatives was a multiple of the cumulative GDP of the planet. Can that be rational?
Maybe it’s investment in innovation that is lacking, rather than education, dedication or ability. I believe this is directly traceable to the wealth and income disparity that has grown dramatically since 1980, and the resulting resource misallocation.
I tend to be rather simple-minded in this area, so it’s nice to actually be on the right track.
JzB
I think you’re right on target with your comment and your post, but as to the immediate above: I got (justifiably) smacked down for exactly this assertion in comments to a previous post. (Which I’m too lazy to look up at the moment — on my way out to dinner with some friends.
The notional value of those derivatives is meaningless. 1. Most of them (all of them?) cancel each other out, and 2. They’re not assets; they’re bets.
Just to amplify (good burger!): if I bet that the slowest horse in the race will win, and I stand to get a million dollars if I do win, is that bet worth a million dollars?
@Asymptosis
Only if the horse wins.
[…] in, money, a.k.a. “liquidity.” A criticism of three of the refuseniks–that the report fails to […]
[…] Main Street.I haven't pulled these numbers for past years,* but it's clear that this disparity has grown hugely since the 80s, driven by credit issued by the financial industry, to the financial industry, with the money […]
[…] haven’t pulled these numbers for past years,* but it’s clear that this disparity has grown hugely since the 80s, driven by credit issued by the financial industry, to the financial industry, with the money […]
[…] haven’t pulled these numbers for past years,* but it’s clear that this disparity has grown hugely since the 80s, driven by credit issued by the financial industry, to the financial industry, with the money […]
[…] (For more on this, which I’ll call the Demand-Side Theory of Money Creation, see my key inspirations for this post here, here, and here.) […]
[…] value of financial assets by reducing demand for them; the second increases it. As Dirk Bezemer has explained, borrowing-driven booms in financial asset values drain resources from the real economy, and so are […]