Do higher taxes result in slower growth? That’s the basic assertion made by tax-cut advocates. If we lower taxes, we’ll grow faster and all boats–rich and poor–will rise. It’s a great idea. Too bad it’s not true.
Few will disagree that in the short term (generally), tax increases impede growth. But over the long term (recent decades) it’s hard to find any support for the assertion–at least for developed nations like the U.S.
Let’s take a look at those nations (data from the OECD–total taxes including federal, state, and local):

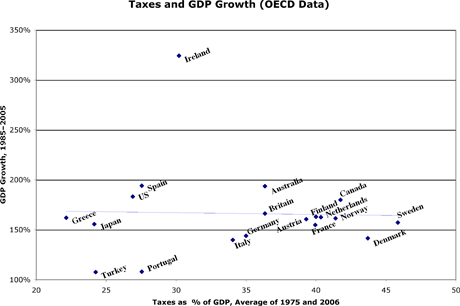
If taxes have a profound effect on growth, you’d expect to see a trend from the upper left (low taxes, high growth) to the lower right. And there is the faintest glimmer of one–check out the trend line.
Over twenty years the difference between low (23%) and high (46%) taxers was a profound several percentage points of GDP growth.
And in the cluster of six lowest-taxing countries, four are below the trend line. (Why hasn’t the lowest-taxing country, Greece, seen explosive growth? Lots of reasons. But taxation doesn’t seem to be a factor.)
But how about if we drill down into the details? Maybe the ’75/’06 tax average is misrepresenting things, because some countries raised taxes more. To check, let’s look at Spain, Australia, Canada, and the US, which lead the main pack of developed countries:
1975–2006 Spain Australia Canada US
Average tax 28% 36% 42% 27%
Tax increase 99% 6% 50% 10%
There doesn’t seem to be any pattern there.
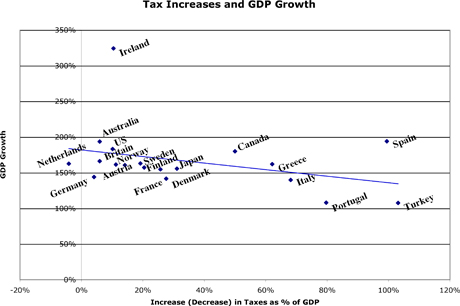
Just to be sure, let’s compare the increase in total taxes for these countries to the growth in their real GDP:

There’s definitely more of a trend here. On the other hand, look at the top of the pack again: Australia, US, Canada, and Spain. They’re spread all across the graph.
And the Netherlands, the one country that actually cut total taxes over this period, has had just average growth.
So there’s somewhat iffy evidence here that raising taxes (within these ranges) slows long-term growth. But there’s not a shred of evidence that taxes in the range of 30–50% of GDP are the catastrophe that American anti-taxers assert.
In fact, since all of these stable, prosperous, successful countries tax in the range of 25–50% GDP, the strongest evidence we see here is that taxes (or actually, expenditures) in that range are necessary to that prosperity.
Obviously, you have to wonder about Ireland. What happened there? As you can see, it wasn’t total tax burden; Ireland’s in the low-middle range of OECD countries. And it wasn’t a reduction in overall taxes; total tax burden in Ireland increased by 10% from 1975 to 2006. Tax activists will point to low corporate taxes, and that was certainly a factor. (Though it’s not crazy to argue that international corporate tax competitions just shift GDP from one country to another, rather than creating wealth.) Fact is, there were many reasons for the “Irish Miracle” (largely monetary, fiscal, and EU-related). See “Tiger Tiger Burning Bright: An economic miracle with many causes” from The Economist. (Free PDF here.)
Update: I’m not the only person who’s pointed this out. There have been dozens of studies by economists, and the results are resounding: in developed, prosperous countries taxing in the range of 28-50% of GDP, there’s no correlation between tax burden and growth. It’s a myth.
Comments
6 responses to “Government: BAD? — Part 3: Taxes and GDP Growth”
Excellent analysis – thanks!
[…] compare a lot of developed countries over decades, you see that lower taxes and smaller government don’t result in faster growth. Tax cuts are an effective vote-buying political pander (who likes paying […]
[…] me like all the mainstream economists (plus me with my little spreadsheet full of OECD data–see post) are right: in developed countries with taxes in the 25-45% of GDP range, government size in and of […]
[…] too short to draw any effective conclusions. Hoping he’ll serve up longer-term analyses, such as this. And he only looks at the […]
[…] By this standard of propter hoc analysis, R&R’s paper shows less analytical rigor than many posts by amateur internet econocranks. (Oui, comme moi.) This is a paper by top Harvard economists, and they didn’t use the most elementary analytical techniques used by real growth econometricians, and even by rank amateurs who are doing their first tentative stabs at understanding the data out there. […]
[…] By this standard of propter hoc analysis, R&R’s paper shows less analytical rigor than many posts by amateur internet econocranks. (Oui, comme moi.) This is a paper by top Harvard economists, and they didn’t use the most elementary analytical techniques used by real growth econometricians, and even by rank amateurs who are doing their first tentative stabs at understanding the data out there. […]