Or: Thinking About Periods and Lags
No need to rehash this cock-up, except to point to the utterly definitive takedown by Arindrajit Dube over at Next New Deal (hat tip: Krugman), and to point out that the takedown might just take even if you’re looking at R&R’s original, skewed data.
But a larger point: I frequently see econometrics like R&R’s, comparing Year t to Year t and suggesting — usually only implicitly or with ever so many caveats and disqualifiers — that it demonstrates some kind of causation. I.e. GDP growth in 1989 vs. debt in 1989, ’90 vs. ’90, etc.
Haven’t they heard of looking at lags, and at multiple lags and periods? It’s the most elementary and obvious method (though obviously not definitive or dispositive) for trying to tease out causation. Because cause really does almost always precede effect. Time doesn’t run backwards. (Unless you believe, like many economists, that people, populations: 1. form both confident and accurate expectations about future macro variables, 2. fully understand the present implications of those expectations, and 3. act “rationally” — as a Platonic economist would — based on that understanding.)
By this standard of propter hoc analysis, R&R’s paper shows less analytical rigor than many posts by amateur internet econocranks. (Oui, comme moi.) This is a paper by top Harvard economists, and they didn’t use the most elementary analytical techniques used by real growth econometricians, and even by rank amateurs who are doing their first tentative stabs at understanding the data out there.
Here’s one example looking at multiple periods and multiple lags, comparing European growth to U.S. growth (click for larger).
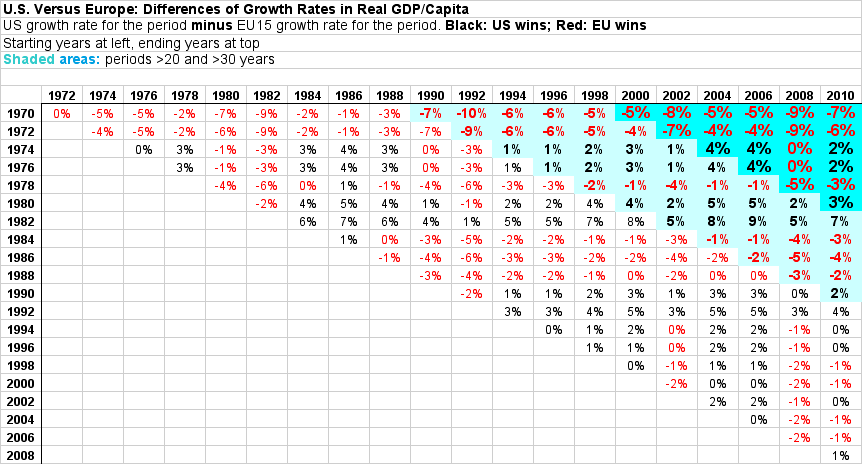
This doesn’t show the correlations between growth and various imagined causes for the periods (tax levels, debt levels, etc.) — just the difference, EU vs. US, in real GDP/capita growth. You have to do the correlations in your head, knowing, for instance, that the U.S. over this period taxed about 28% of GDP, while European countries taxed 30–50%, averaging about 40%.
But it does show the way to analyzing those correlations (and possible causalities), by looking at multiple periods and multiple lags. (I’d love to see multiple tables like this populated with correlation coefficients for different “causes.”)
Dube tackles the lag issue for the R&R sample beautifully in his analysis. In particular, he looks at both positive and negative lags. So, where do we see more correlation:
A. between last year’s growth and this year’s debt, or
B. between last year’s debt and this year’s growth?
The answer is B:
Figure 2: Future and Past Growth Rates and Current Debt-to-GDP Ratio

(Also: if there’s any breakpoint for the growth effects of government debt, as suggested by R&R, it’s way below 90% of GDP. More like 30%.) See Dube’s addendum for a different version of these graphs, using another method to incorporate multiple lags.
Here’s what I’d really like to see: analysis like Dube’s using as its inputs many tables like the one above, each populated with correlations for a different presumed cause (“instrumental variable”). Combine that with Xavier Sala-i-Martin’s technique in his paper, “I just ran four million regressions“.
That paper looks at fifty-nine different possible causes of growth/instrumental variables (not including government debt/GDP ratio) in every possible combination, to figure out which ones might deliver robust correlations. I’m suggesting combining that with multiple periods and lags for each instrumental variable. IOW, “I just ran 4.2 billion regressions.” Not sure if we’ve got the horsepower yet, but…
Cross-posted at Angry Bear.
Comments
15 responses to “Note to Reinhart/Rogoff (et. al): The Cause Usually Precedes the Effect”
Let’s be specific here.
Does Debt to GDP mean Gov’t Debt to GDP, Private Debt to GDP, or Gov’t Debt + Private Debt to GDP?
@Fed Up
Federal debt/gdp.
Importantly: debt held by the public, not gross debt. So it doesn’t include debt that the government owes itself, like the money “owed” by general government to the SS trust fund.
IOW, it’s debt on the unified balance sheet.
[…] “Note to Reinhart/Rogoff (et. al): The Cause Usually Precedes the Effect”Asymptosis, Apr 19, 2013http://www.asymptosis.com/note-to-reinhartrogoff-et-al-the-cause-usually-precedes-the-effect.html […]
@Asymptosis
I believe private debt plus gov’t debt to GDP is important, if not more important, than gov’t debt.
I think gross gov’t debt should be accounted for somehow.
@Fed Up
Amen to that, Fed. Alternatively, we could consider applying the “other things equal” clause to private debt — and if R&R and the rest of ’em can’t do that, then all their studies of public debt go right out the window.
Never let up.
ps, I prefer looking at private and public debt relative to circulating money.
@The Arthurian
What do you consider “circulating money” to be?
And, “we could consider applying the “other things equal†clause to private debt — and if R&R and the rest of ‘em can’t do that, then all their studies of public debt go right out the window.”
I doubt if there is any data from the past where “other things equal” applies.
[…] other day I dissed the analysis in Reinhart and Rogoff’s Growth in a Time of Debt as being on the level of a blog post […]
[…] other day I dissed the analysis in Reinhart and Rogoff’s Growth in a Time of Debt as being on the level of a blog post […]
@Fed Up
M1. See the notes here
“M1 includes funds that are readily accessible for spending.”
M2 = M1 + savings on some definition, but since saving = notSpending, the savings portion of M2 is not circulating.
MZM is sometimes said to be spendable money… but ALL money is spendable on some definition. But as Sober Look we read
“Money market funds traditionally have been included in certain broad measures of money stock (such as MZM)…”
and
“investors … view money market funds as higher-yielding savings accounts”
So MZM includes M1 and a different measure of savings, basically.
I look at TCMDO/M1SL or /M1ADJ
For a look farther back in time, see here.
Hi Steve,
– I don’t think it’s the case that most econometricians or economists
are unaware of time series methods. I’m also unconvinced that time
series are either the definitive or the most obvious way to do causal
inference. Both those ideas seem quite hard to support to me, though
YMMV.
– By the way, R&R analyse /three/ datasets: 200 year longitudinal data
for 20 countries; a panel of 20 emerging economies over a 40 year
period; and a panel of 20 advanced economies over a 50 year period.
– So in all three of the datasets, R&R are doing more than simply
“comparing Year t to Year t”.
– Anyway, R&R obviously made some mistakes in their paper, including a couple
of embaressing errors.
– On the other hand, the effect of the embaressing errrors is to
change one estimate (from one dataset) by a couple of tenths of a
percent. From discussion in blogs, a person might come away with the
opposite impression, i.e., that it’s a spreadsheet error that
generates the extreme result at 90% debt/GDP, and that this
torpedoes the entire paper.
– Most of the difference between HAP and R&R estimates is explained by
judgement calls that are quite reasonable in R&R’s case.
– The basic disagreement between HAP and R&R is that HAP treat all
countries as fundamentally the same, whereas R&R treat them as
different. Thus, for HAP, 19 observations on Greece and 4 on the US
equate to 23 observations of the same thing — all countries at >=
90% grow at the same rate. Whereas R&R treat Greece and the US as
different, with different expected growth rates.
– If you make a bunch of (highly restrictive / unlikely) assumptions
about mean growth rates and error variances across different
countries in the model, then HAP might be correct, but it seems
straightfowardly inferior to R&R’s less crude analysis —
spreadsheet errors excepted — although neither strikes me as
especially rigorous or comprehensive.
vimothy :
I agree. But they do fail to use them very frequently. R&R just being an egregious, front-and-center example.
Absolutely not definitive or dispositive. (Cause does not always precede effect; expectations matter.) They do seem the most obvious to me, though.
I don’t understand how para 2 follows from para 1.
To answer the rest, I’ll just say that I think Dube is the definitive takedown, not HAP.
@Asymptosis
I agree. But they do fail to use them very frequently. R&R just being an egregious, front-and-center example.
1, What is your metric for this? My impression is that the opposite is true.
2, R&R did use time series data, so whatever one thinks about the state of economic research in this respect, it seems a bit besides the point.
What in your view is so egregious about R&R?
The silly errors were just that, but they don’t contribute much to the difference between R&R and HAP. The difference comes from the way they treat the observations they have — or in other words, it comes from the different assumptions they make about the underlying data generating process.
It’s not true that the assumptions R&R make are obviously and unambiguously wrong. In fact, they are quite reasonable — possibly more reasonable than the assumptions made by HAP.
I don’t understand how para 2 follows from para 1.
It follows by definition.
Panel data are data with a time dimension, so that takes care of two datasets. “Longitudinal” is just another way to say “time series”, so that takes care of the third.
Steve,
So I’ve had a read of the Dube blog post you reference in your above
comment. I think that it’s a neat little article. In fact, I wish that
there were more like it in the econ blogosphere. It’s good to see some
data analysis — /in general/ — and I think Dube in particular here
makes a coherent case for the causal effect running from growth to
debt rather than vice versa.
On the other hand, I wouldn’t describe it as a definitive take-down of
R&R as you did in the OP. Really, it extends both R&R and HAP in
useful ways, because neither paper tried seriously to address the
issue of causality. So if Dube finds that the causal effect goes in
one direction, that doesn’t expose R&R for making schoolboy errors.
But I’d be interested to hear what you think those schoolboy errors
were. As I understand them, the accusations from HAP, which started
the whole /furore/, were that R&R,
1. dropped some observations due to a spreadsheet error;
2. didn’t include some data that was nevertheless collected;
3. averaged the data in a weird and inexplicable way;
and that this was the reason they got the drop-off in mean growth at
90% debt/GDP. The main point that has been pushed by commenters in the
media is that R&R’s figure for GDP growth at that debt/GDP level was
*wrong*, and that the *right* answer doesn’t show any sort of
non-linear drop-off at 90%.
Taking these in turn: 1 is fair, as R&R acknowledged. 2 is poorly made
and the accusations of “selective exclusion” of data are not
warranted. Some data was collected, an analysis done. Some more data
was collected, and another analysis done — and published. There’s
nothing untoward in that. Note that both these points can be construed as
technical errors (leaving aside the issue of whether 2 is fair).
What’s not a technical error is point 3. The correct way to take the
average depends on the assumptions that you make about the process
you’re trying to measure. Both HAP and R&R’s methods are reasonable
and defensible. Basically, if all countries are the same, then X
observations at 90% from one country and Y observations from another
amount to X + Y observations of the same thing, and HAP’s method is
correct. If the two countries are not the same, then R&R’s method is
preferable.
The important thing to note here is that point 3 is not any kind of
technical error. It’s a reasonable way to come up with an
estimate. What’s interesting is that points 1 and 2 contribute a tiny
amount to the difference between R&R and HAP’s estimates — a few
tenths of a percentage point. All the remainder is explained by the
choice of estimator (i.e., how they averaged the data). But the
controversy was generated by the idea that it’s the schoolboy errors
that destroy the result, and not the fact that HAP made a different
judgement call about the underlying process being observed and
measured.
Not schoolboy errors, rather schoolboy analysis.
How I would put it: The use of valuable methodologies (based on lag analysis) by Dube, methodologies that can go some way toward sussing out causations, exposes the schoolboy quality of R&R’s childishly simplistic analysis.
The use of childishly simplistic analytical methods, and failure to use even the most rudimentary time-lag methods in an effort to understand the causal relationships between the variables.
Really, I think all the rest is mostly chaff. If Dube had gone after the original data as presented (even with the spreadsheet error), I’m guessing his results would have been largely similar.
IOW, HAP wasn’t important so much as the data release accompanying it. (And HAP also got people talking about the paper, its data, and its lame analysis methods. Dube could have done the same takedown absent HAP (well, if he had the data). But happily, HAP (largely the accompanying data release) spurred him to do so.
@Asymptosis
Steve,
Could you be a bit more precise about what you mean by childishly
simple analysis? What is that R&R do or don’t do that is so lame?
If the answer is “failure to estimate a distributed lag model,” could
you say what it is about a distributed lag model that makes it not
childishly simple or lame, vs R&R’s analysis?