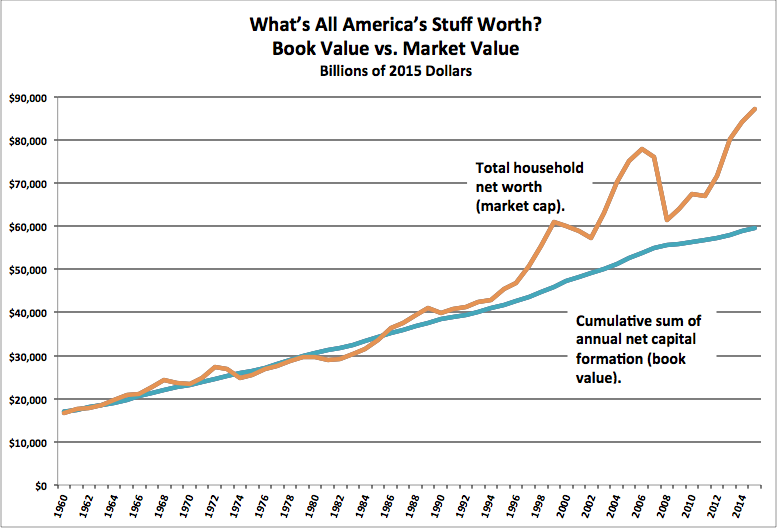
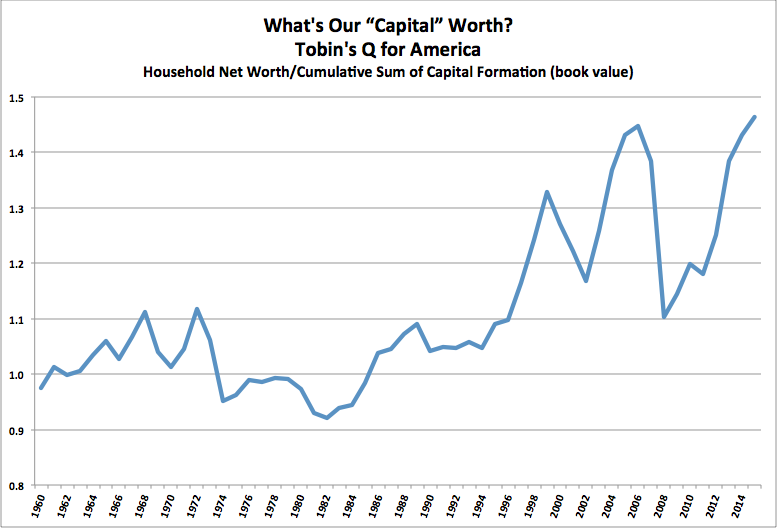
In recent posts on the Integrated Macroeconomic Accounts, I’ve highlighted that we have two market estimates of what America’s “capital” is worth — the cumulative sum of net investment (roughly, “book value”), and total household wealth (“market value”). I got curious: how to they compare over the decades? What’s America’s market-to-book ratio, or Tobin’s Q?
Here are two pictures depicting that:
And here’s how I calculated them based on the IMA’s table S.2.a, plus BEA inflation measures (spreadsheet here):
Start with the IMA’s estimate of total household net worth in 1960 (expressed in 1960 dollars), as the asset markets’ best estimate of what all America’s stuff (“capital”) was worth at that moment.
Inflation-adjust that value to show it in 2015 dollars. (Choose your deflator; I tried a few, but settled on simple old CPI.)
Add net capital formation (net of capital consumption) for 1960, again expressed in 2015 dollars. This is the value of stuff added to our stock. That gives you book value of our stuff in 1961 (the 1960 stock of stuff, plus new stuff added).
Repeat for each ensuing year, ending in 2015 with a cumulative sum of all those years’ net capital formation. This is the 2015 “book value” of that accumulated stuff, expressed in 2015 dollars. (See: Perpetual Inventory Method.)
Now for comparison, look at the IMAs’ annual estimates of household net worth, with each year converted to 2015 dollars. These are the asset-markets’ year-by-year estimates of the value of all our stuff. (Alternatively you could use “U.S. Net Wealth” from Table B.1, which excludes the value of land and nonproduced nonfinancial assets.)
Is this interesting or significant? Do these pictures tell us anything useful?
The main takeaway, I think: since the mid 90s, the measures of capital formation have been having a lot of trouble capturing the value of…new capital formation. Hard-to-measure intellectual, human, and social capital have increasingly dominated our economy. The existing-asset markets incorporate that new “capital” into their estimate of our total worth, but measures of sales in the new-goods markets have trouble doing so. (This even after the 2013 GDP revisions, which added much “intangible” value to its measures, notably intellectual property and even “brand value.”)
For example, how valuable are the services from Facebook, Twitter, and Google? Nobody pays anything for them. And the advertising spending that supports them (in case you were wondering) is not counted as part of GDP. Advertising is considered an “intermediate good,” an “input to production,” so is excluded from the “value added” that is GDP. (For reference, U.S. advertising spending is about $150 billion a year — 0.8% of GDP.) The stock market knows (thinks) those firms have value, but how much “capital formation” do they do? It’s a pretty dicey question.
Apply the same kind of thinking to even harder-to-measure human intangibles like knowledge and skills, developed through education and training, and you probably have a pretty good explanation of the divergence between the book and market lines over recent decades.


Comments
5 responses to “What’s All Our Stuff Worth? Tobin’s Q for America”
Hmm, that doesn’t totally resonate with me. How is something “wealth” if it isn’t paid for? After all, wealth is the NPV of future income streams. Something can add to utility but not wealth. If i design a pill that makes us all 10% happier but then give it away for free, I have not added to financial wealth (ignoring second-order effects) even though I have added to “utility.”
It would be interesting to check the source of the increase in household net worth. If the increase can be attributed to technology not being accounted for correctly in net investment then the added net worth should be due to higher stock prices. On the other hand, a housing price bubble might drive net worth without being “technology driven”.
A simple graph to answer the question is the following: https://fred.stlouisfed.org/graph/?g=c5ot
“Technology” might be able to explain the first and last spike in the American Tobin-Q metric. But it does not seem to explain the second one.
@Effem
Yeah this post doesn’t touch on utility at all (or only implicitly). It just looks at two measures of accumulation: what’s added each year (measured via sales) vs what we’ve got each year (asset market value).
Wealth here is net worth. Balance-sheet assets minus liabilities.
@Kostas Kalevras
Yeah if trying to suss out cyclical changes. But the long-term secular change has been going on for a quarter century or more. Awfully long “bubble”…
Oh and to add, technical change was just one intangible given as an example. See the last paragraph.
“And the advertising spending that supports them (in case you were wondering) is not counted as part of GDP. Advertising is considered an “intermediate good,†…”
If I buy a new car for my wife, that’s “final” spending and it is counted as part of GDP. The tires on the car add something to the purchase price of the car, so the value of the tires is part of the value that gets added to GDP, the value of the car. The tires are not *also* added separately to GDP, because then the value of the tires would be counted twice.
Like the tires, advertising is “intermediate” spending and to my knowledge is counted the same way. So the advertising IS counted as part of GDP, but it is not added directly so that double-counting may be avoided.
Unless you are saying that advertising and tires are figured differently…